Data codebook
Last updated 2022-01-04
Please cite these data with the following reference:
Condon, D. M., Coughlin, J., & Weston, S. J. (2022). Personality Trait Descriptors: 2,818 Trait Descriptive Adjectives characterized by familiarity, frequency of use, and prior use in psycholexical research. Journal of Open Psychology Data.
Here we present codebook information for the demographic variables including summary statistics and distributions for each. Note that codebook information for the 5,636 vocabulary items has been omitted as this would compromise their validity for subsequent use. Contact the lead author of the reference above for access to this information.
The data can be downloaded here. NOTE that the csv version of these data will mis-read two adjectives when opened in MS Excel: “false” and “blasé”. These must be fixed manually prior to working with the data in Excel (but it appears to work as expected in R).
Please consult the reference listed above for more information about this project.
Metadata
Description
Dataset name: Trait descriptive adjectives (scored)
The dataset has N=3540 rows and 11 columns. 3320 rows have no missing values on any column.
Metadata for search engines
Temporal Coverage: Spring 2020 and Spring 2021
Spatial Coverage: Online
Date published: 2022-01-04
Creator:
| name | value |
|---|---|
| 1 | David Condon, Joshua Coughlin, Sara Weston |
|
#Variables
source
The participant recruitment platform from which the data were sourced.
Distribution
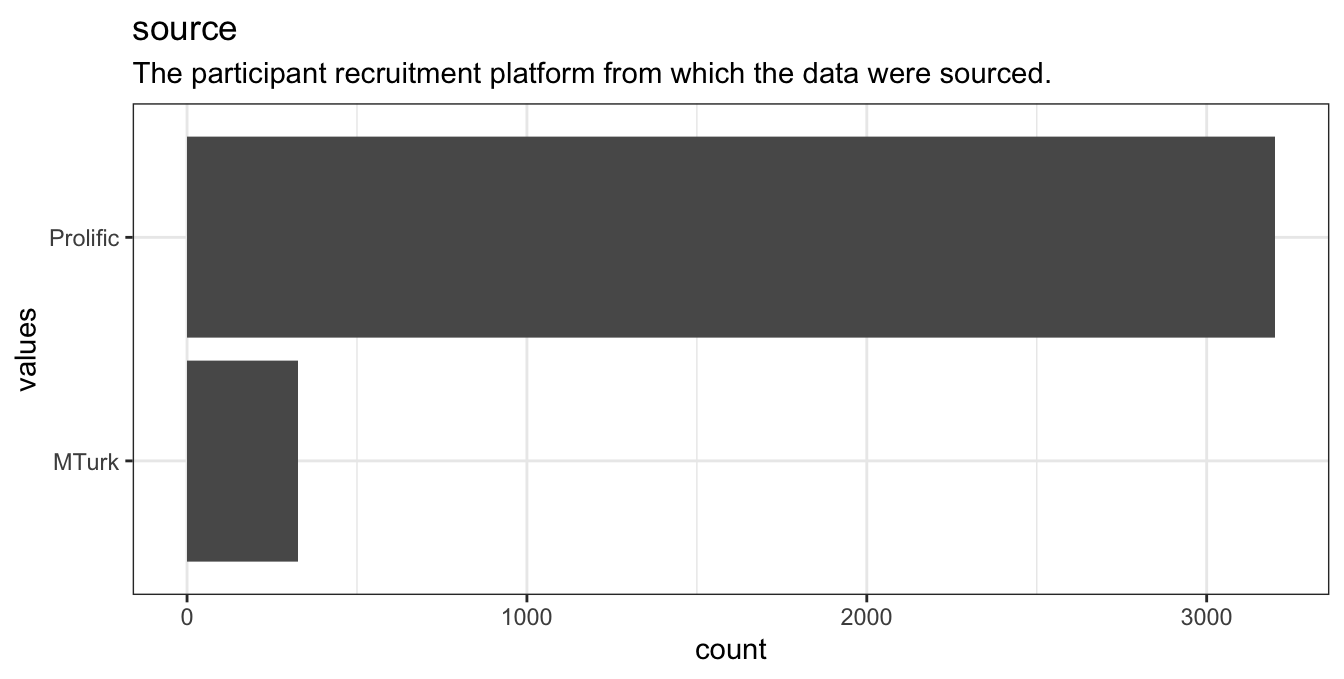
Distribution of values for source
12 missing values.
Summary statistics
| name | label | data_type | n_missing | complete_rate | n_unique | empty | min | max | whitespace |
|---|---|---|---|---|---|---|---|---|---|
| source | The participant recruitment platform from which the data were sourced. | character | 12 | 0.9966102 | 2 | 0 | 5 | 8 | 0 |
english
How well do you speak English?
Distribution
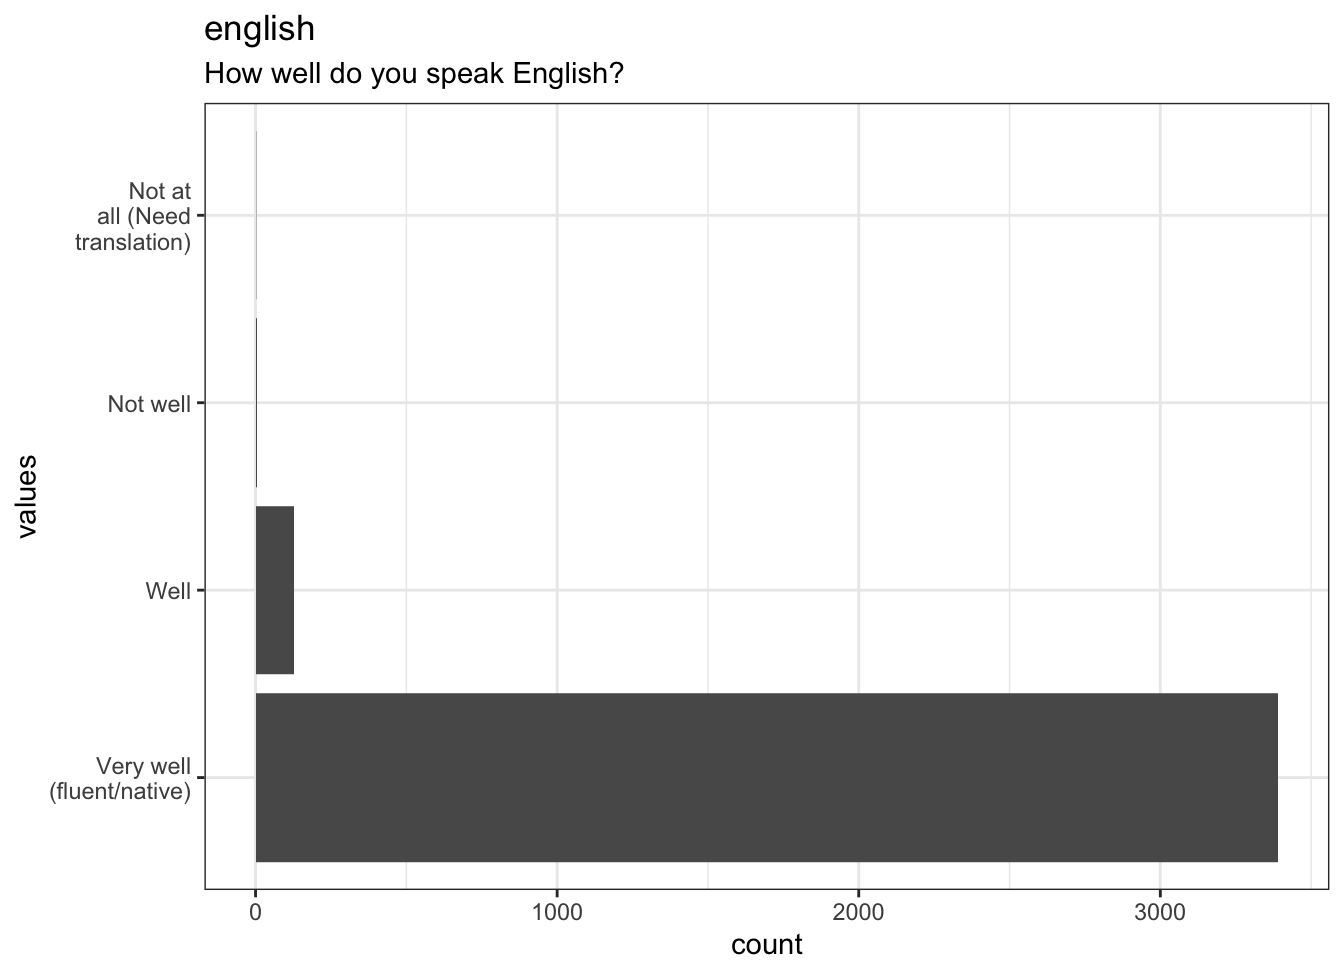
Distribution of values for english
18 missing values.
Summary statistics
| name | label | data_type | ordered | value_labels | n_missing | complete_rate | n_unique | top_counts |
|---|---|---|---|---|---|---|---|---|
| english | How well do you speak English? | factor | FALSE | 1. Very well (fluent/native), 2. Well, 3. Not well, 4. Not at all (Need translation) |
18 | 0.9949153 | 4 | Ver: 3391, Wel: 126, Not: 4, Not: 1 |
growup
Where did you grow up?
Distribution
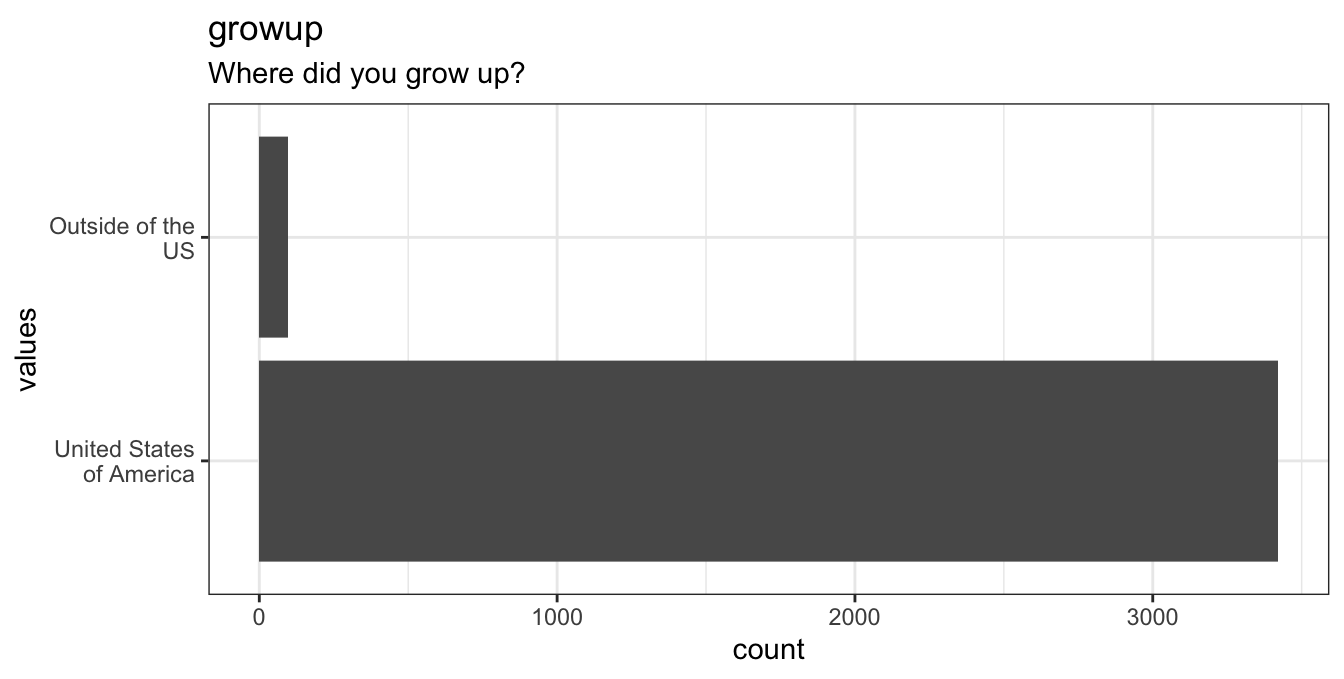
Distribution of values for growup
20 missing values.
Summary statistics
| name | label | data_type | ordered | value_labels | n_missing | complete_rate | n_unique | top_counts |
|---|---|---|---|---|---|---|---|---|
| growup | Where did you grow up? | factor | FALSE | 1. United States of America, 2. Outside of the US |
20 | 0.9943503 | 2 | Uni: 3422, Out: 98 |
live
Do you currently live in one of the 50 states of the USA or the District of Columbia?
Distribution
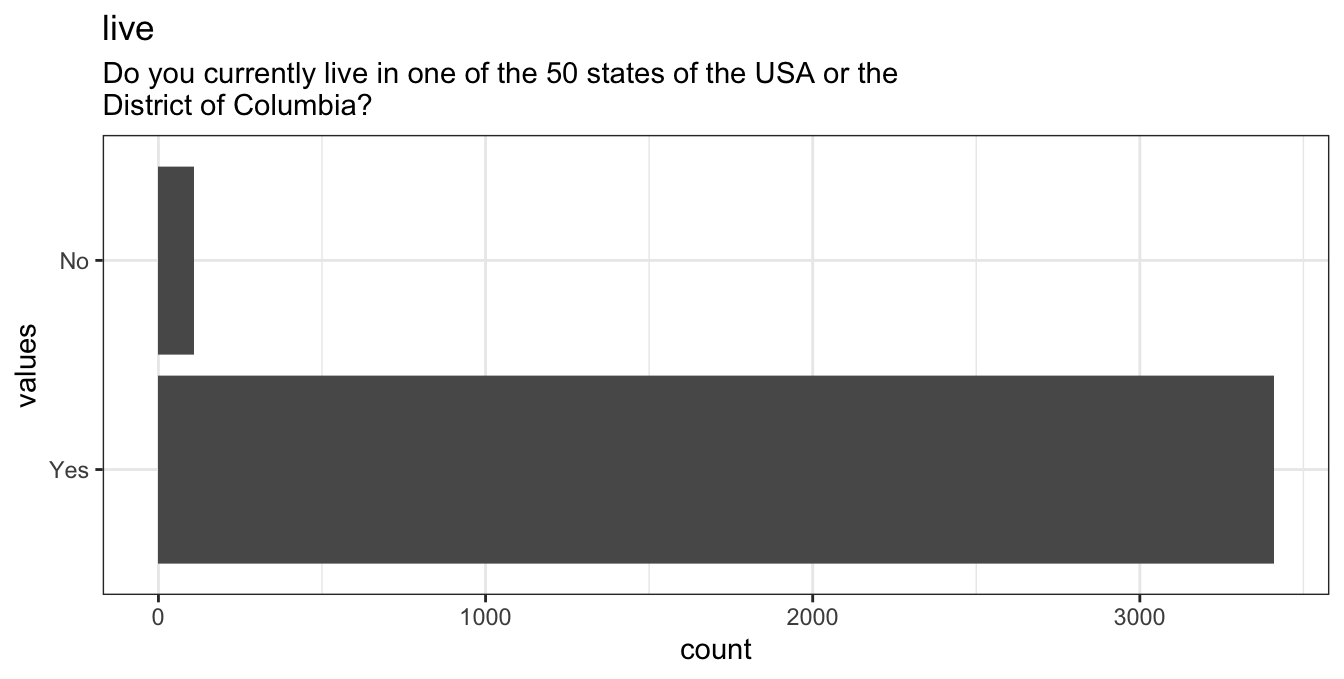
Distribution of values for live
23 missing values.
Summary statistics
| name | label | data_type | ordered | value_labels | n_missing | complete_rate | n_unique | top_counts |
|---|---|---|---|---|---|---|---|---|
| live | Do you currently live in one of the 50 states of the USA or the District of Columbia? | factor | FALSE | 1. Yes, 2. No |
23 | 0.9935028 | 2 | Yes: 3409, No: 108 |
state
Please select the state where you currently live (or spend the most time).
Distribution
## 49 unique, categorical values, so not shown.133 missing values.
Summary statistics
| name | label | data_type | ordered | value_labels | n_missing | complete_rate | n_unique | top_counts |
|---|---|---|---|---|---|---|---|---|
| state | Please select the state where you currently live (or spend the most time). | factor | FALSE | 1. Alabama, 2. Alaska, 3. Arizona, 4. Arkansas, 5. California, 6. Colorado, 7. Connecticut, 8. Delaware, 9. District of Columbia, 10. Florida, 11. Georgia, 12. Hawaii, 13. Idaho, 14. Illinois, 15. Indiana, 16. Iowa, 17. Kansas, 18. Kentucky, 19. Louisiana, 20. Maine, 21. Maryland, 22. Massachusetts, 23. Michigan, 24. Minnesota, 25. Mississippi, 26. Missouri, 27. Montana, 28. Nebraska, 29. Nevada, 30. New Hampshire, 31. New Jersey, 32. New Mexico, 33. New York, 34. North Carolina, 35. North Dakota, 36. Ohio, 37. Oklahoma, 38. Oregon, 39. Pennsylvania, 40. Rhode Island, 41. South Carolina, 42. South Dakota, 43. Tennessee, 44. Texas, 45. Utah, 46. Vermont, 47. Virginia, 48. Washington, 49. West Virginia, 50. Wisconsin, 51. Wyoming |
133 | 0.9624294 | 49 | Cal: 373, Tex: 256, Flo: 249, New: 249 |
age
Age (in years).
Distribution
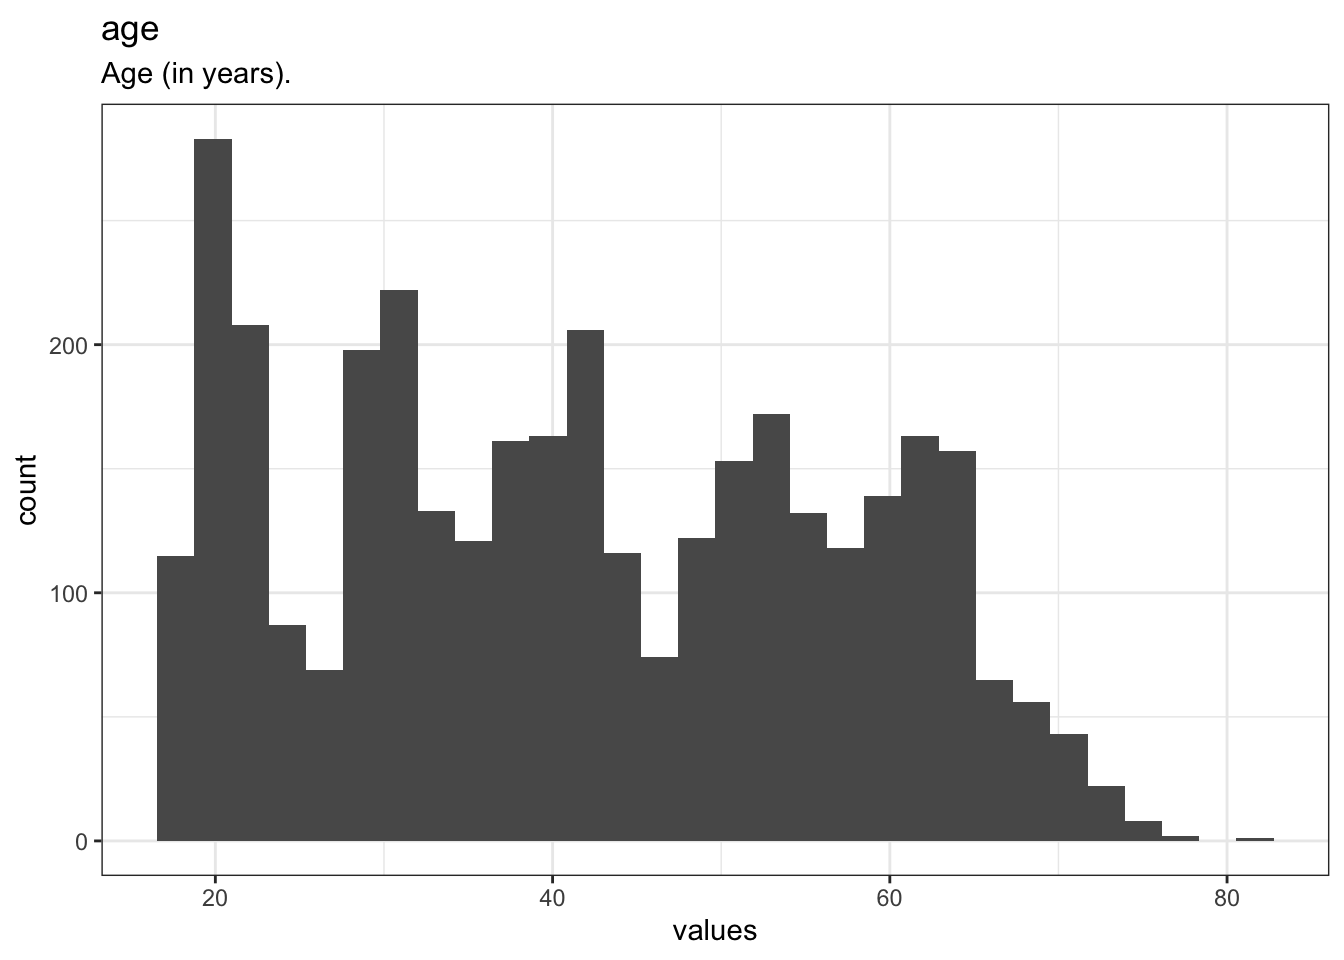
Distribution of values for age
31 missing values.
Summary statistics
| name | label | data_type | n_missing | complete_rate | min | median | max | mean | sd | hist |
|---|---|---|---|---|---|---|---|---|---|---|
| age | Age (in years). | numeric | 31 | 0.9912429 | 18 | 40 | 82 | 41.53149 | 15.46967 | ▇▇▆▅▁ |
sex
Biological sex at birth.
Distribution
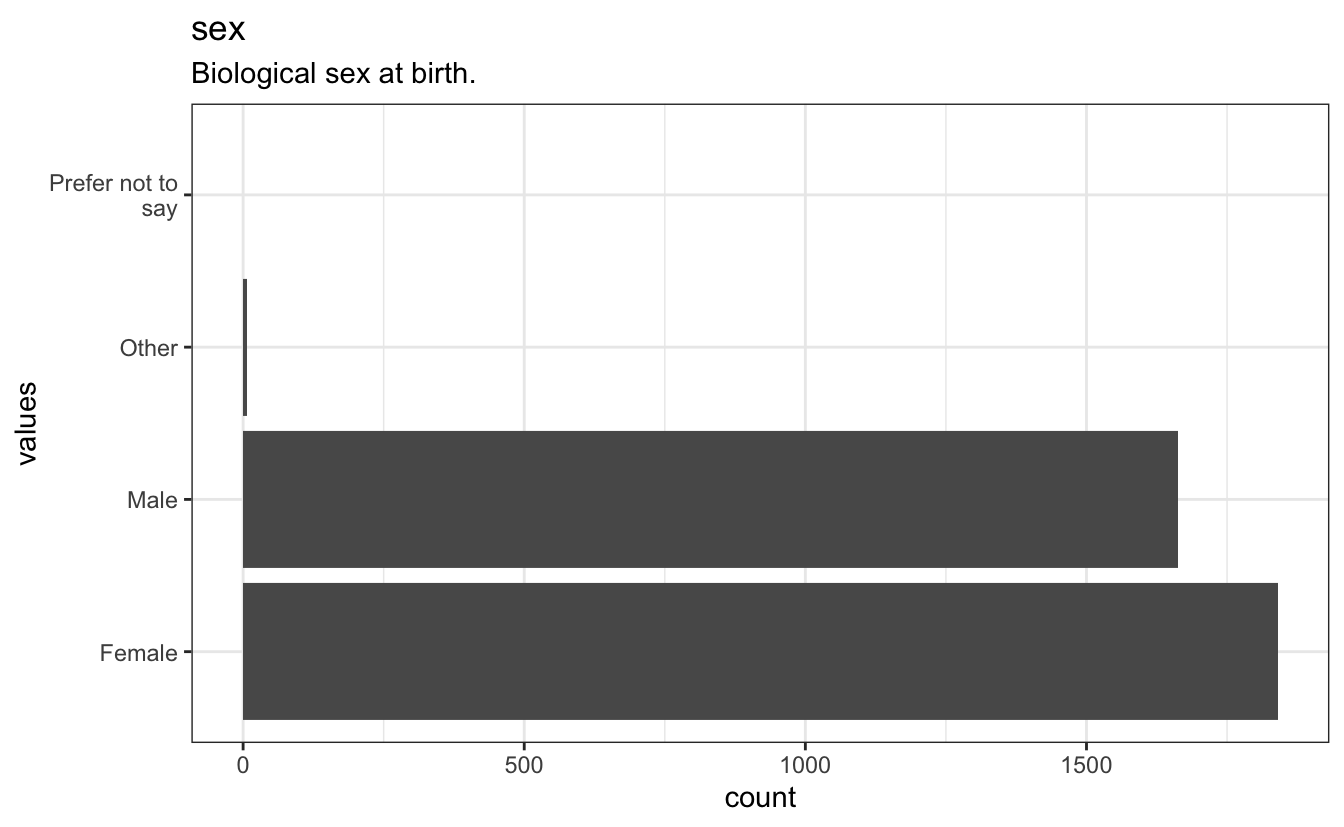
Distribution of values for sex
31 missing values.
Summary statistics
| name | label | data_type | ordered | value_labels | n_missing | complete_rate | n_unique | top_counts |
|---|---|---|---|---|---|---|---|---|
| sex | Biological sex at birth. | factor | FALSE | 1. Male, 2. Female, 3. Other, 4. Prefer not to say |
31 | 0.9912429 | 3 | Fem: 1840, Mal: 1662, Oth: 7, Pre: 0 |
edu
Level of education.
Distribution
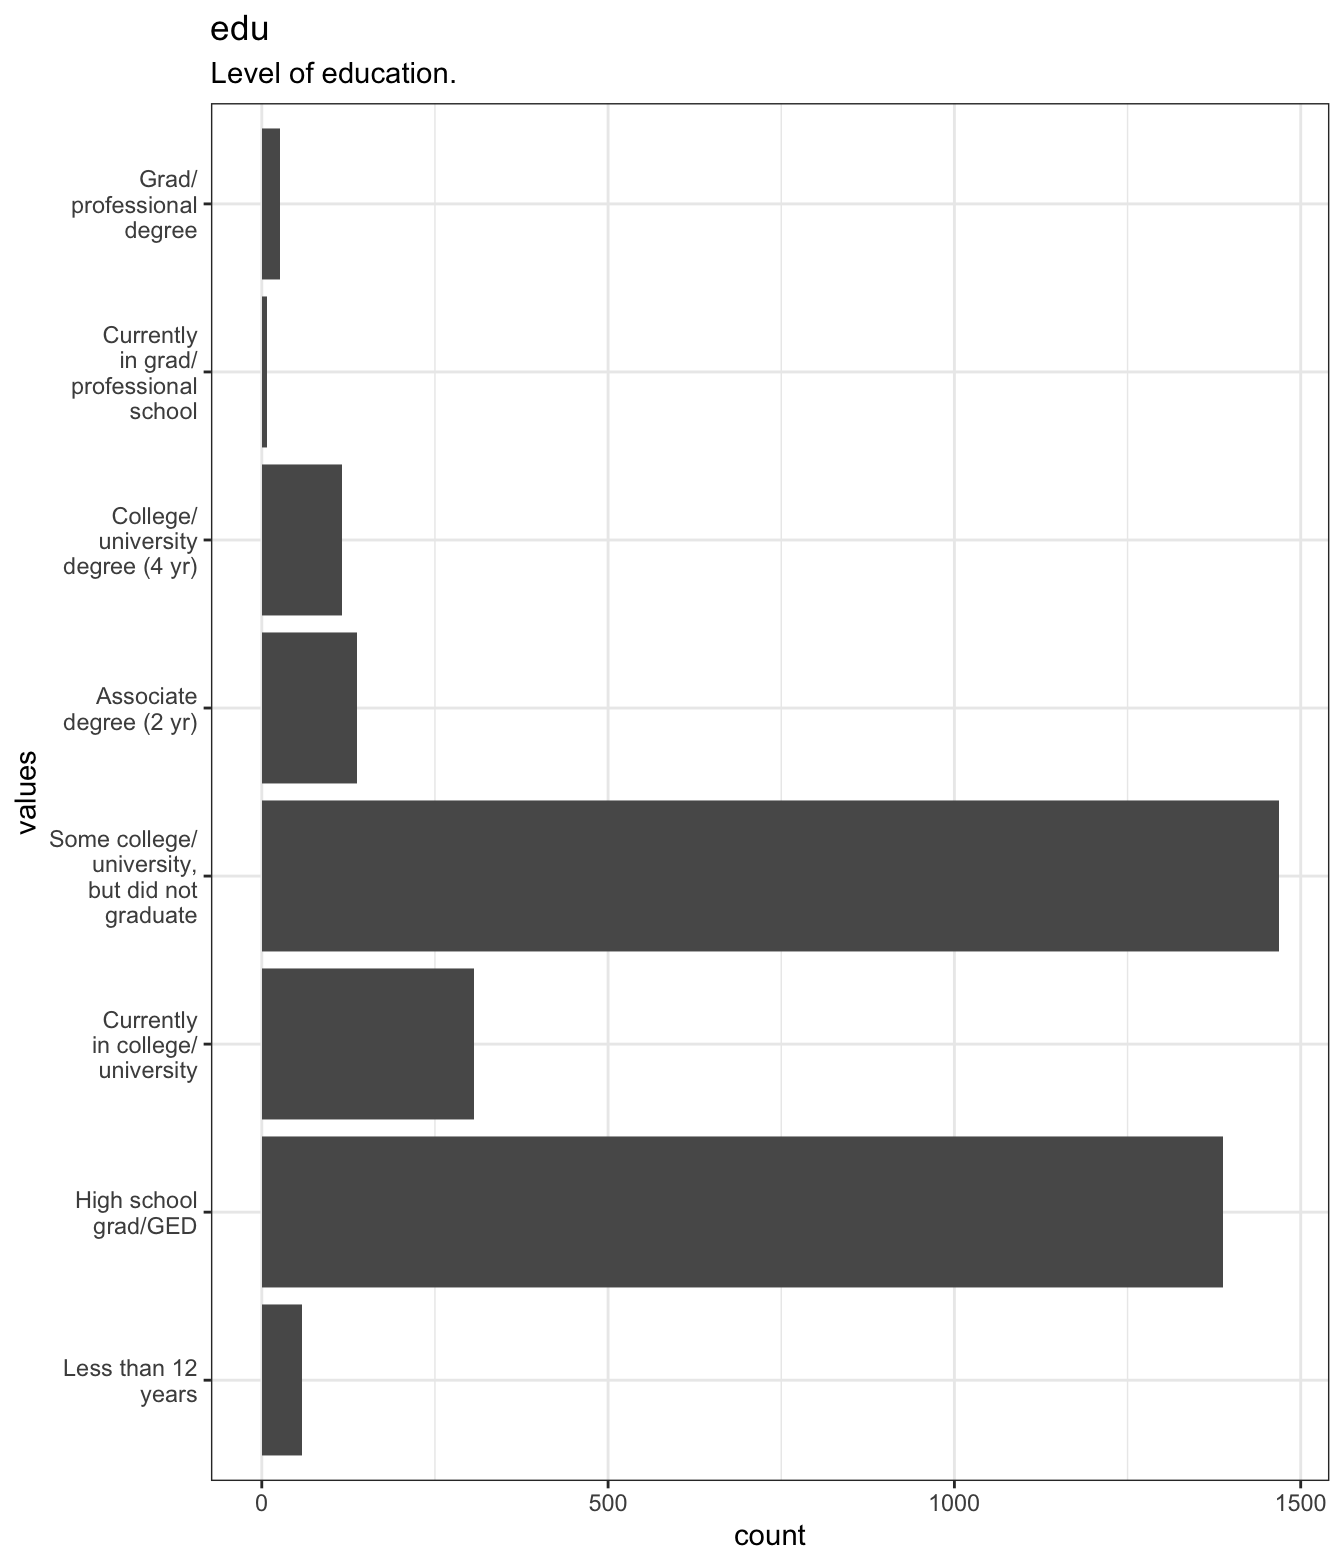
Distribution of values for edu
31 missing values.
Summary statistics
| name | label | data_type | ordered | value_labels | n_missing | complete_rate | n_unique | top_counts |
|---|---|---|---|---|---|---|---|---|
| edu | Level of education. | factor | FALSE | 1. Less than 12 years, 2. High school grad/GED, 3. Currently in college/university, 4. Some college/university, but did not graduate, 5. Associate degree (2 yr), 6. College/university degree (4 yr), 7. Currently in grad/professional school, 8. Grad/professional degree |
31 | 0.9912429 | 8 | Som: 1468, Hig: 1388, Cur: 307, Ass: 137 |
ethnic
Racial or ethnic background.
Distribution
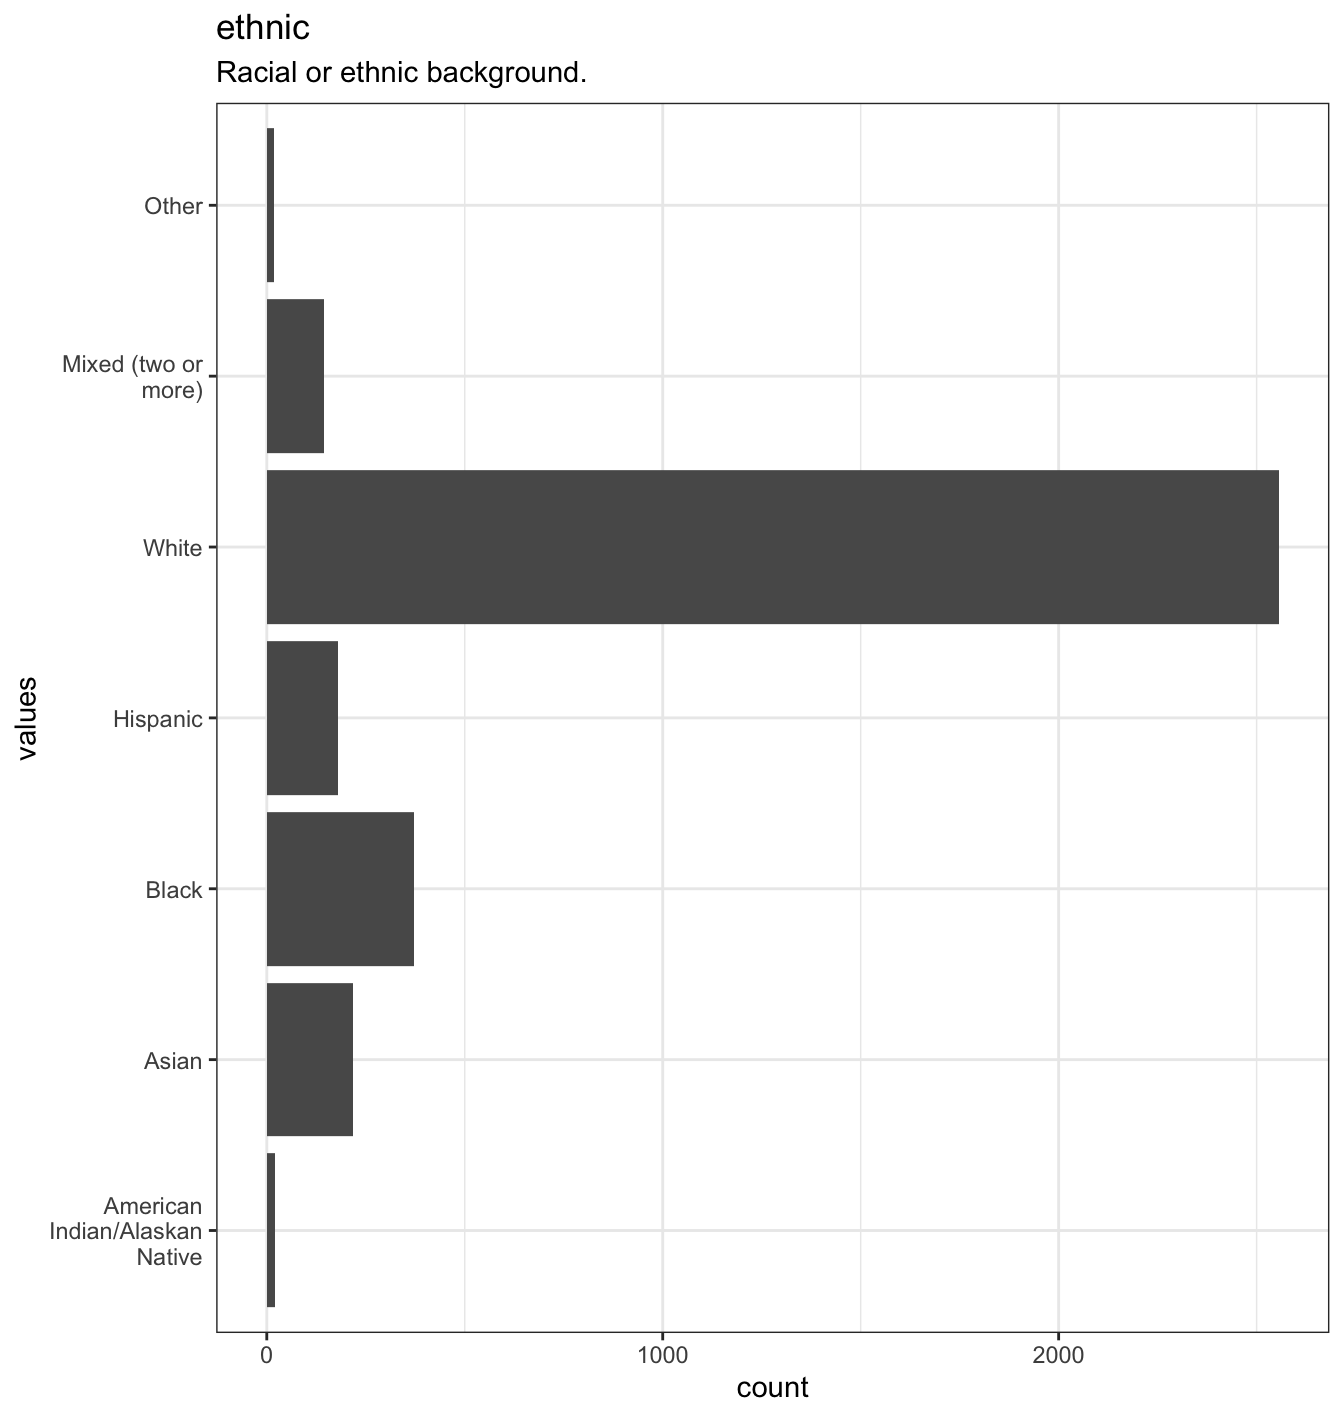
Distribution of values for ethnic
33 missing values.
Summary statistics
| name | label | data_type | ordered | value_labels | n_missing | complete_rate | n_unique | top_counts |
|---|---|---|---|---|---|---|---|---|
| ethnic | Racial or ethnic background. | factor | FALSE | 1. American Indian/Alaskan Native, 2. Asian, 3. Black, 4. Hispanic, 5. White, 6. Mixed (two or more), 7. Other |
33 | 0.990678 | 7 | Whi: 2556, Bla: 371, Asi: 218, His: 179 |
hhinc
Household income.
Distribution
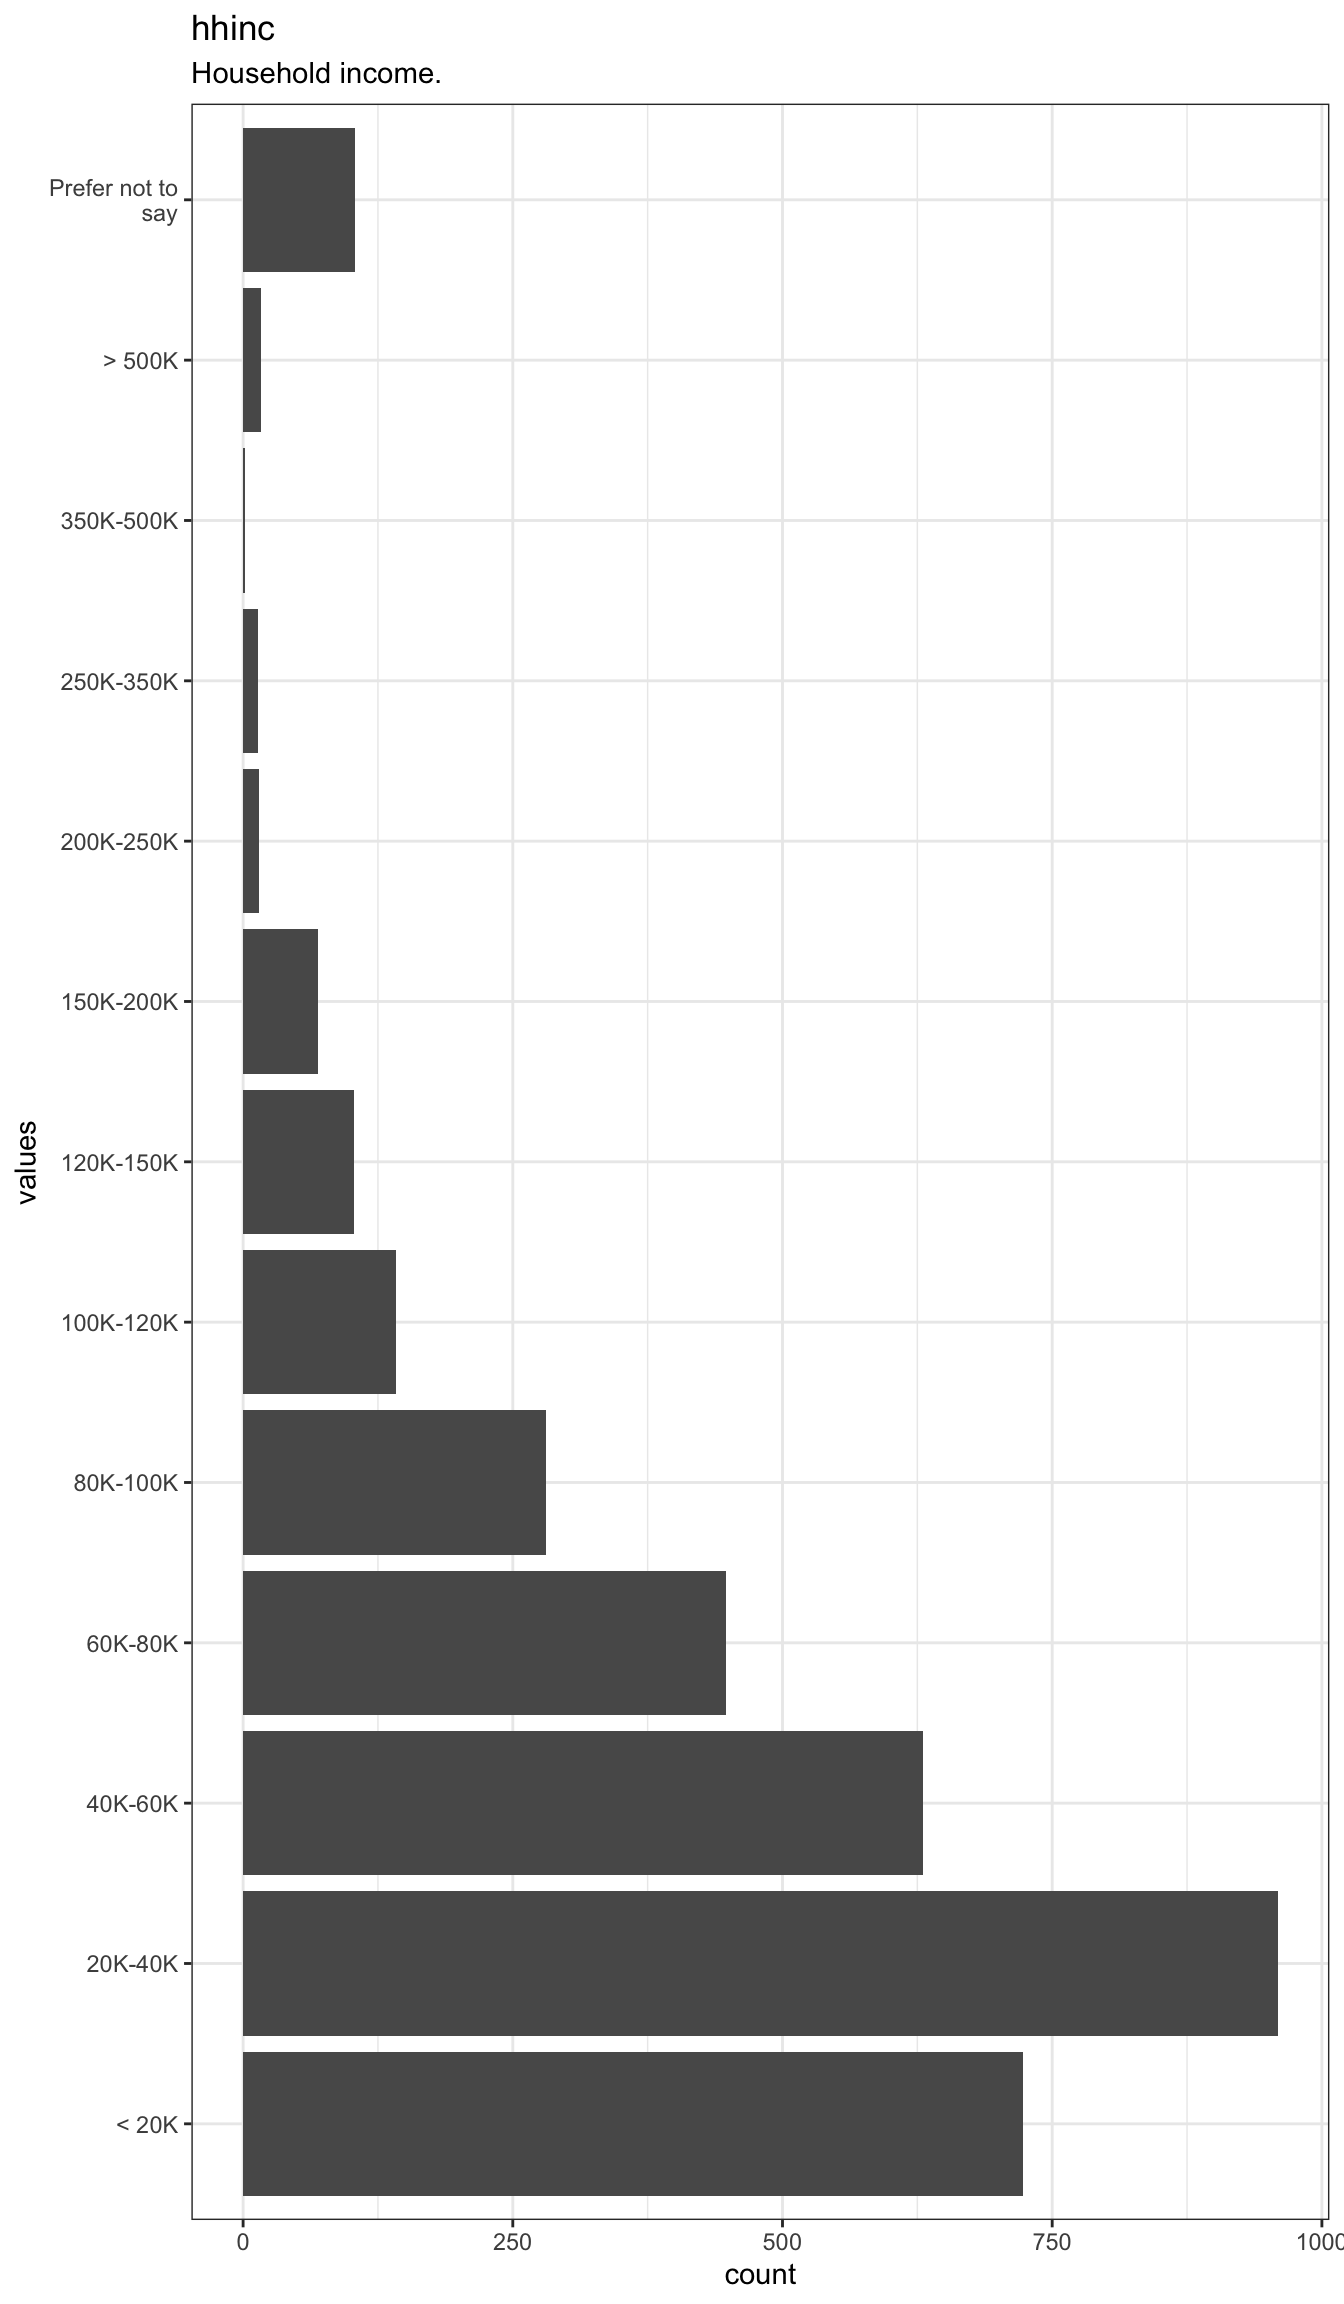
Distribution of values for hhinc
33 missing values.
Summary statistics
| name | label | data_type | ordered | value_labels | n_missing | complete_rate | n_unique | top_counts |
|---|---|---|---|---|---|---|---|---|
| hhinc | Household income. | factor | FALSE | 1. < 20K, 2. 20K-40K, 3. 40K-60K, 4. 60K-80K, 5. 80K-100K, 6. 100K-120K, 7. 120K-150K, 8. 150K-200K, 9. 200K-250K, 10. 250K-350K, 11. 350K-500K, 12. > 500K, 13. Prefer not to say |
33 | 0.990678 | 13 | 20K: 959, <: 723, 40K: 630, 60K: 448 |
prop_correct
Proportion of correct responses.
Distribution
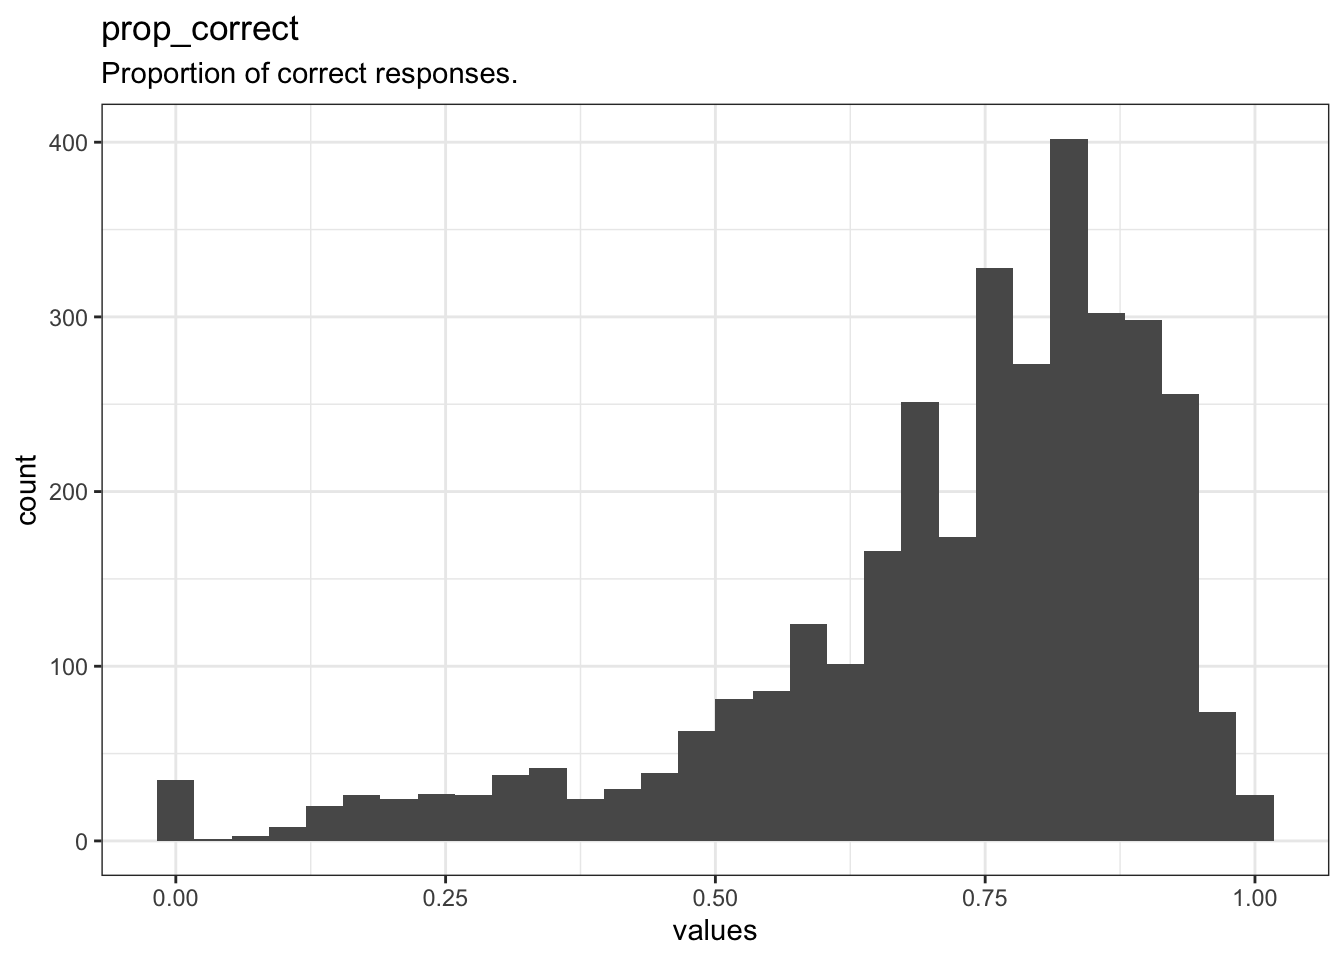
Distribution of values for prop_correct
192 missing values.
Summary statistics
| name | label | data_type | n_missing | complete_rate | min | median | max | mean | sd | hist |
|---|---|---|---|---|---|---|---|---|---|---|
| prop_correct | Proportion of correct responses. | numeric | 192 | 0.9457627 | 0 | 0.77 | 1 | 0.7223072 | 0.1961658 | ▁▁▂▇▇ |
Missingness report
Codebook table
JSON-LD metadata
The following JSON-LD can be found by search engines, if you share this codebook publicly on the web.
{
  "name": "Trait descriptive adjectives (scored)",
  "creator": "David Condon, Joshua Coughlin, Sara Weston",
  "temporalCoverage": "Spring 2020 and Spring 2021",
  "spatialCoverage": "Online",
  "datePublished": "2022-01-04",
  "description": "The dataset has N=3540 rows and 11 columns.\n3320 rows have no missing values on any column.\n\n\n## Table of variables\nThis table contains variable names, labels, and number of missing values.\nSee the complete codebook for more.\n\n|name         |label                                                                                 | n_missing|\n|:------------|:-------------------------------------------------------------------------------------|---------:|\n|source       |The participant recruitment platform from which the data were sourced.                |        12|\n|english      |How well do you speak English?                                                        |        18|\n|growup       |Where did you grow up?                                                                |        20|\n|live         |Do you currently live in one of the 50 states of the USA or the District of Columbia? |        23|\n|state        |Please select the state where you currently live (or spend the most time).            |       133|\n|age          |Age (in years).                                                                       |        31|\n|sex          |Biological sex at birth.                                                              |        31|\n|edu          |Level of education.                                                                   |        31|\n|ethnic       |Racial or ethnic background.                                                          |        33|\n|hhinc        |Household income.                                                                     |        33|\n|prop_correct |Proportion of correct responses.                                                      |       192|\n\n### Note\nThis dataset was automatically described using the [codebook R package](https://rubenarslan.github.io/codebook/) (version 0.9.2).",
  "keywords": ["source", "english", "growup", "live", "state", "age", "sex", "edu", "ethnic", "hhinc", "prop_correct"],
  "@context": "http://schema.org/",
  "@type": "Dataset",
  "variableMeasured": [
    {
      "name": "source",
      "description": "The participant recruitment platform from which the data were sourced.",
      "@type": "propertyValue"
    },
    {
      "name": "english",
      "description": "How well do you speak English?",
      "value": "1. Very well (fluent/native),\n2. Well,\n3. Not well,\n4. Not at all (Need translation)",
      "@type": "propertyValue"
    },
    {
      "name": "growup",
      "description": "Where did you grow up?",
      "value": "1. United States of America,\n2. Outside of the US",
      "@type": "propertyValue"
    },
    {
      "name": "live",
      "description": "Do you currently live in one of the 50 states of the USA or the District of Columbia?",
      "value": "1. Yes,\n2. No",
      "@type": "propertyValue"
    },
    {
      "name": "state",
      "description": "Please select the state where you currently live (or spend the most time).",
      "value": "1. Alabama,\n2. Alaska,\n3. Arizona,\n4. Arkansas,\n5. California,\n6. Colorado,\n7. Connecticut,\n8. Delaware,\n9. District of Columbia,\n10. Florida,\n11. Georgia,\n12. Hawaii,\n13. Idaho,\n14. Illinois,\n15. Indiana,\n16. Iowa,\n17. Kansas,\n18. Kentucky,\n19. Louisiana,\n20. Maine,\n21. Maryland,\n22. Massachusetts,\n23. Michigan,\n24. Minnesota,\n25. Mississippi,\n26. Missouri,\n27. Montana,\n28. Nebraska,\n29. Nevada,\n30. New Hampshire,\n31. New Jersey,\n32. New Mexico,\n33. New York,\n34. North Carolina,\n35. North Dakota,\n36. Ohio,\n37. Oklahoma,\n38. Oregon,\n39. Pennsylvania,\n40. Rhode Island,\n41. South Carolina,\n42. South Dakota,\n43. Tennessee,\n44. Texas,\n45. Utah,\n46. Vermont,\n47. Virginia,\n48. Washington,\n49. West Virginia,\n50. Wisconsin,\n51. Wyoming",
      "@type": "propertyValue"
    },
    {
      "name": "age",
      "description": "Age (in years).",
      "@type": "propertyValue"
    },
    {
      "name": "sex",
      "description": "Biological sex at birth.",
      "value": "1. Male,\n2. Female,\n3. Other,\n4. Prefer not to say",
      "@type": "propertyValue"
    },
    {
      "name": "edu",
      "description": "Level of education.",
      "value": "1. Less than 12 years,\n2. High school grad/GED,\n3. Currently in college/university,\n4. Some college/university, but did not graduate,\n5. Associate degree (2 yr),\n6. College/university degree (4 yr),\n7. Currently in grad/professional school,\n8. Grad/professional degree",
      "@type": "propertyValue"
    },
    {
      "name": "ethnic",
      "description": "Racial or ethnic background.",
      "value": "1. American Indian/Alaskan Native,\n2. Asian,\n3. Black,\n4. Hispanic,\n5. White,\n6. Mixed (two or more),\n7. Other",
      "@type": "propertyValue"
    },
    {
      "name": "hhinc",
      "description": "Household income.",
      "value": "1. < 20K,\n2. 20K-40K,\n3. 40K-60K,\n4. 60K-80K,\n5. 80K-100K,\n6. 100K-120K,\n7. 120K-150K,\n8. 150K-200K,\n9. 200K-250K,\n10. 250K-350K,\n11. 350K-500K,\n12. > 500K,\n13. Prefer not to say",
      "@type": "propertyValue"
    },
    {
      "name": "prop_correct",
      "description": "Proportion of correct responses.",
      "@type": "propertyValue"
    }
  ]
}`