title: “Device effects” date: “Last updated 2023-08-11” output: bookdown::html_document2: toc: TRUE toc_float: TRUE —
In this section, we present exploratory analyses which test the effect of device type More specifically, we’re interested to know whether the time it takes to complete personality assessments differs by device type (computer, phone, tablet). We also test whether the typical response to personality items is associated with device type, although we have no theoretical reasons to suspect this is the case.
For these analyses, we use only data collected in Block 1.
Deviations from preregistration
We were unable to extract significance values for interactions using
the aov function, which would have tested effects using an
F-test. Instead, we use car::Anova, which uses a \(\chi^2\) test.
Analyses
items_block1 = items_df %>% filter(block == "1")Demographics by device type
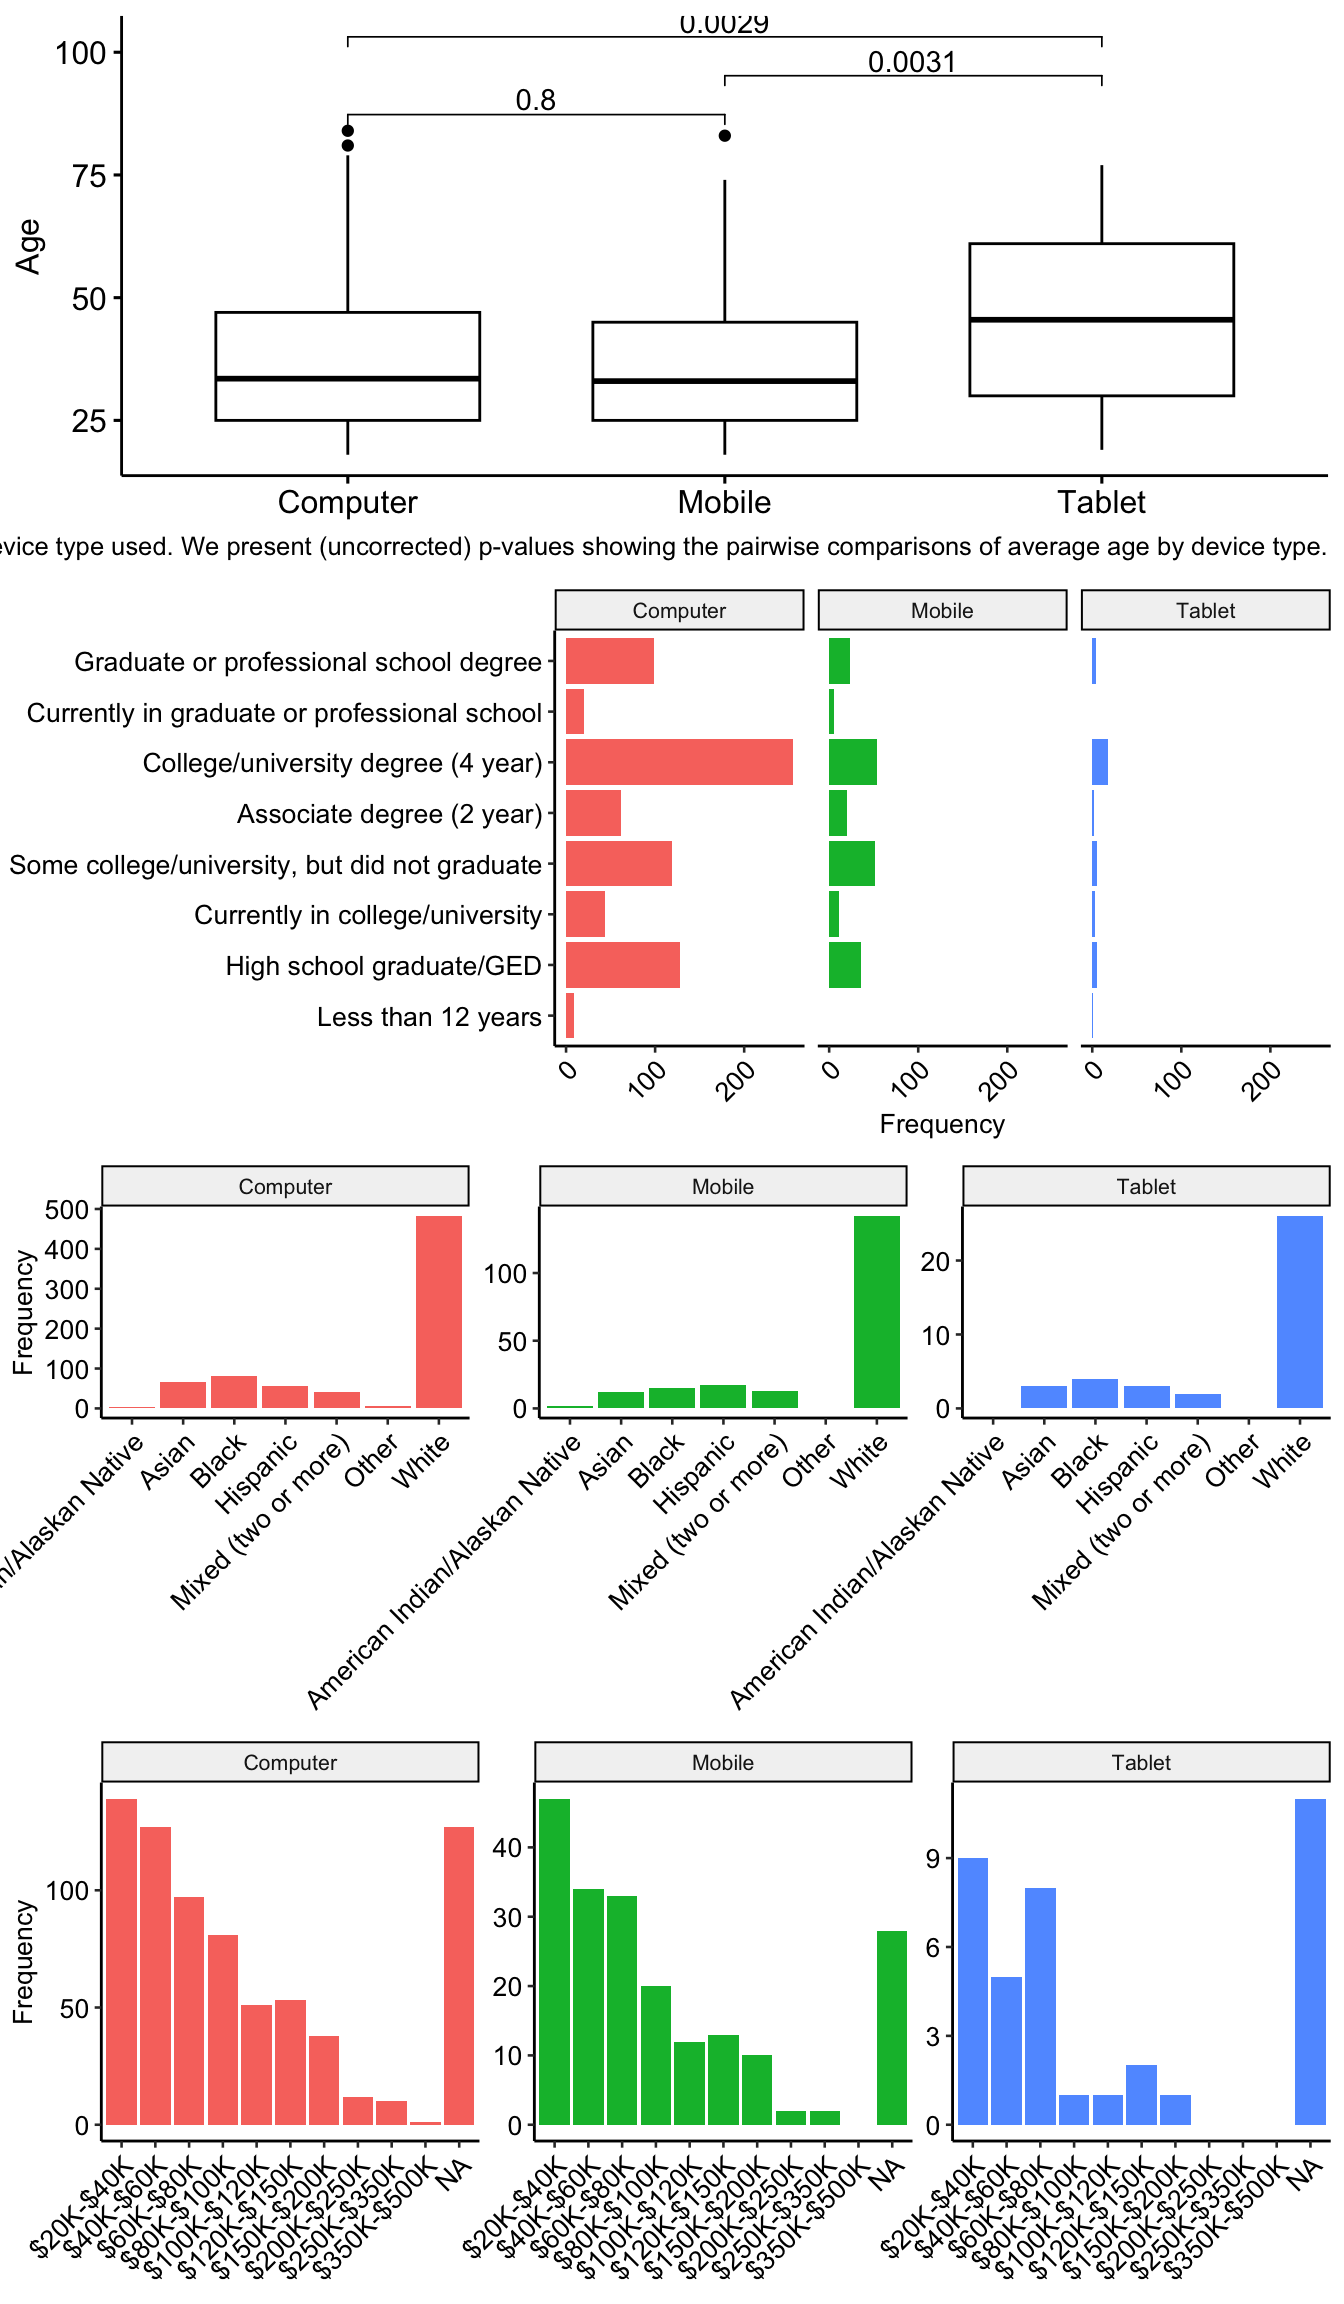
Device-type analyses in this project are purely exploratory, but may be hampered by potential confounds. We test whether different types of participants (based on demographic variables) used different devices to complete the survey.
## # A tibble: 3 × 4
##   devicetype Female  Male Other
##   <fct>       <int> <int> <int>
## 1 Computer      343   392     1
## 2 Mobile        110    89     2
## 3 Tablet         24    14    NA
Figure @ref(fig:descriptives-17)A shows the distributions of age by device type; the ANOVA test of these differences is \(F(2, 972) = 6.72\), \(p = .001\), \(\hat{\eta}^2_G = .014\), 90% CI \([.003, .027]\). The chi-square test of biological sex by device type was \(\chi^2(4, n = 975) = 11.70\), \(p = .020\).
Distributions by device type
Timing
Timing by device
We used a multilevel model, nesting timing within participant to account for dependence. Our primary predictor was device type. As a reminder, our outcome variable (seconds) has been log-transformed, as it was strongly skewed.
mod.timing = glmmTMB(seconds_log~devicetype + (1|proid),
                  data = items_block1)
tidy(car::Anova(mod.timing))
## # A tibble: 1 × 4
## term statistic df p.value
## <chr> <dbl> <dbl> <dbl>
## 1 devicetype 9.29 2 0.00963Device type was associated with the time it took to respond to personality items \((\chi^2(2.00) = 9.29, p = .010)\).
avg_predictions(mod.timing, variables = "devicetype") %>%
  mutate(
    across(where(is.numeric), exp)
  ) %>%
  ggplot(aes(x = devicetype, y = estimate)) +
  geom_bar(stat = "identity", fill = "grey") +
  geom_errorbar(aes(ymin = conf.low, ymax = conf.high), width = .5) +
   labs(x = NULL,
       y = "Seconds (per item)",
       title = "Average time per personality item\nby device type",
       caption = "Bars represent 95% confidence intervals") +
  theme_pubclean()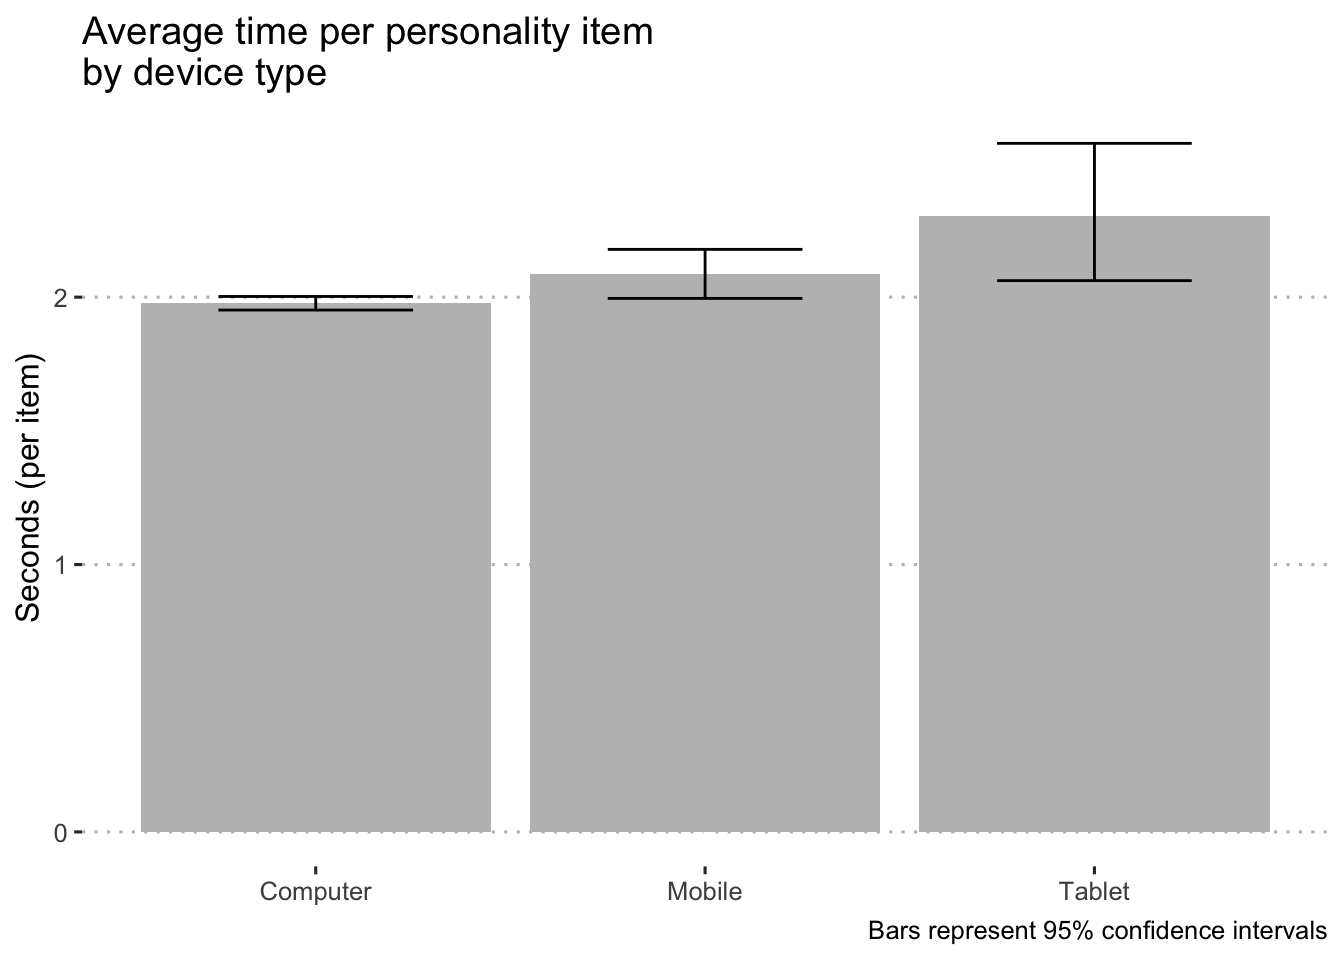
Predicted timing on personality items by condition.
means_by_group = items_block1 %>%
  group_by(devicetype) %>%
  summarise(m = mean(timing),
            s = sd(timing))

items_block1 %>%
  ggplot(aes(x = timing, fill = devicetype)) +
  geom_histogram(bins = 100) +
  geom_vline(aes(xintercept = m), data = means_by_group) +
  facet_wrap(~devicetype, scales = "free_y") +
  guides(fill = "none") +
  scale_x_log10() +
  labs(y = "Number of particpants",
       title = "Distribution of timing by format",
       x = "timing (logrithmic scale)") +
  theme_pubr()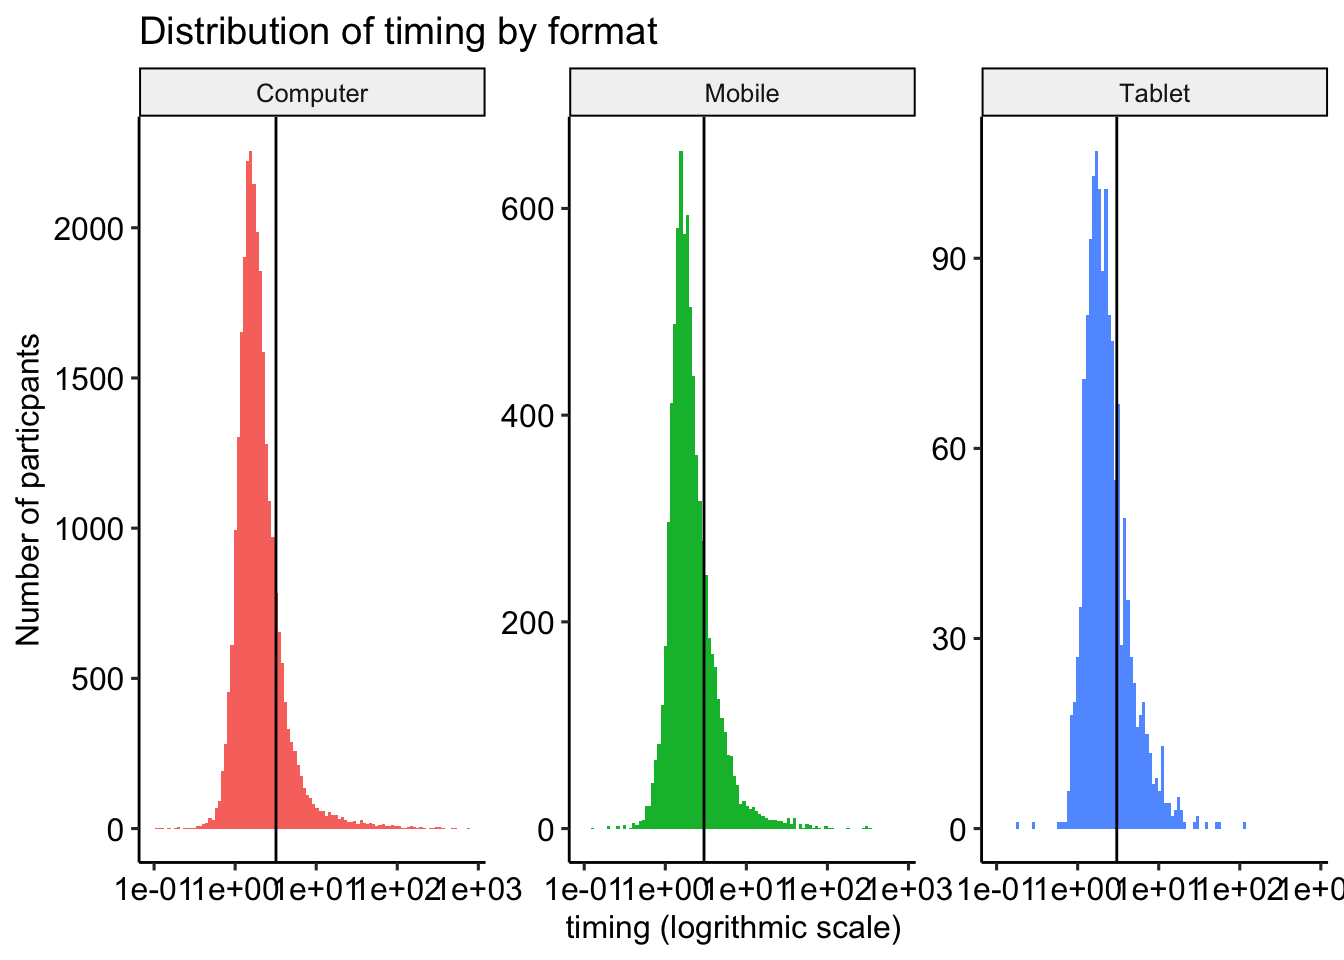
Distribution of seconds by category
Device by format
We also check to see whether device type and format interact in the prediction of time to answer personality items.
mod.timing2 = glmmTMB(seconds_log~devicetype + format + devicetype:format+ (1|proid),
                  data = items_block1)
tidy(car::Anova(mod.timing2))
## # A tibble: 3 × 4
## term statistic df p.value
## <chr> <dbl> <dbl> <dbl>
## 1 devicetype 9.65 2 0.00804
## 2 format 10.2 3 0.0168
## 3 devicetype:format 13.5 6 0.0354tD2_aov = tidy(car::Anova(mod.timing2))
tD2_sig = tD2_aov$p.value[[3]] < .05
tD2_aov = tD2_aov %>%
as_tibble() %>%
mutate(across(starts_with("P"), printp),
across(where(is.numeric), printnum))The interaction between device type and format was associated with the time it took to respond to personality items \((\chi^2(6.00) = 13.53, p = .035)\).
avg_predictions(mod.timing2, variables = c("devicetype", "format")) %>%
  mutate(across(where(is.numeric), exp)) %>%
  ggplot(aes(x = format, y = estimate, group = devicetype)) +
  geom_bar(stat = "identity", aes(fill = devicetype),
           position = position_dodge(.9)) +
  geom_errorbar(aes(ymin = conf.low, ymax = conf.high),
                width = .5,
                position = position_dodge(.9)) +
   labs(x = NULL,
       y = "Seconds (per item)",
       title = "Average time per personality item\nby device type",
       caption = "Bars represent 95% confidence intervals") +
  theme_pubclean()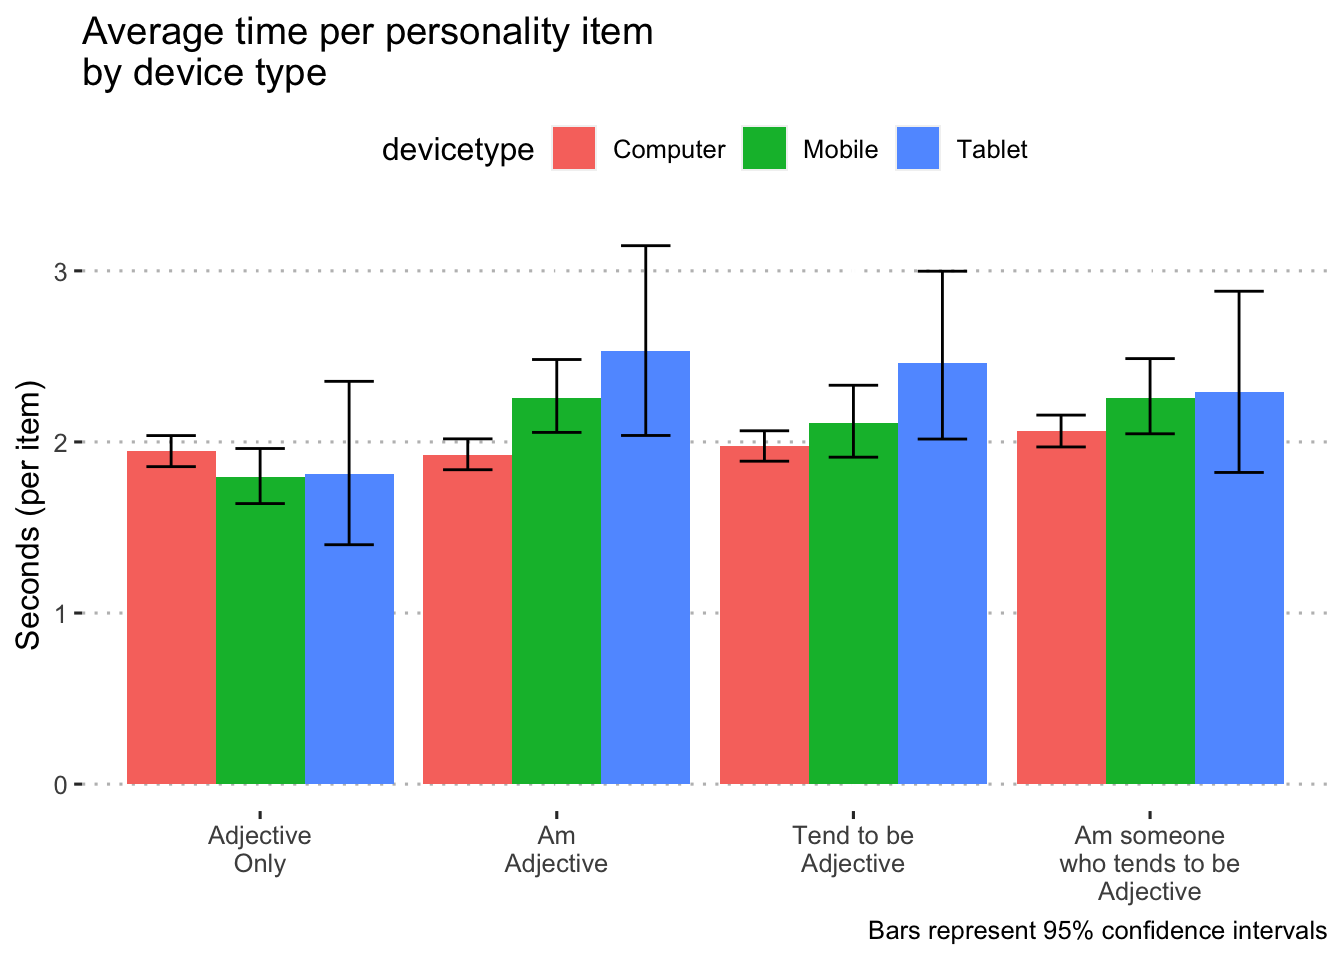
Predicted timing on personality items by condition.
Responses
Here we estimate the differences in response to personality items items by device. Again, we have no theoretical rationale for these models – these are purely exploratory.
Response by device
We used a multilevel model, nesting response within participant to account for dependence. Our primary predictor was device type.
mod.responseD = glmmTMB(response~devicetype + (1|proid),
                  data = items_block1)
tidy(car::Anova(mod.responseD))
## # A tibble: 1 × 4
## term statistic df p.value
## <chr> <dbl> <dbl> <dbl>
## 1 devicetype 0.120 2 0.942When examining both Block 1 and Block 2 data, device type was unassociated with the time it took to respond to personality items \((\chi^2(2.00) = 0.47, p = .626)\).
avg_predictions(mod.responseD, variables = "devicetype") %>%
  ggplot(aes(x = devicetype, y = estimate)) +
  geom_bar(stat = "identity", fill = "grey") +
  geom_errorbar(aes(ymin = conf.low, ymax = conf.high), width = .5) +
   labs(x = NULL,
       y = "Expected response",
       title = "Expected responses by device",
       caption = "Bars represent 95% confidence intervals") +
  theme_pubclean()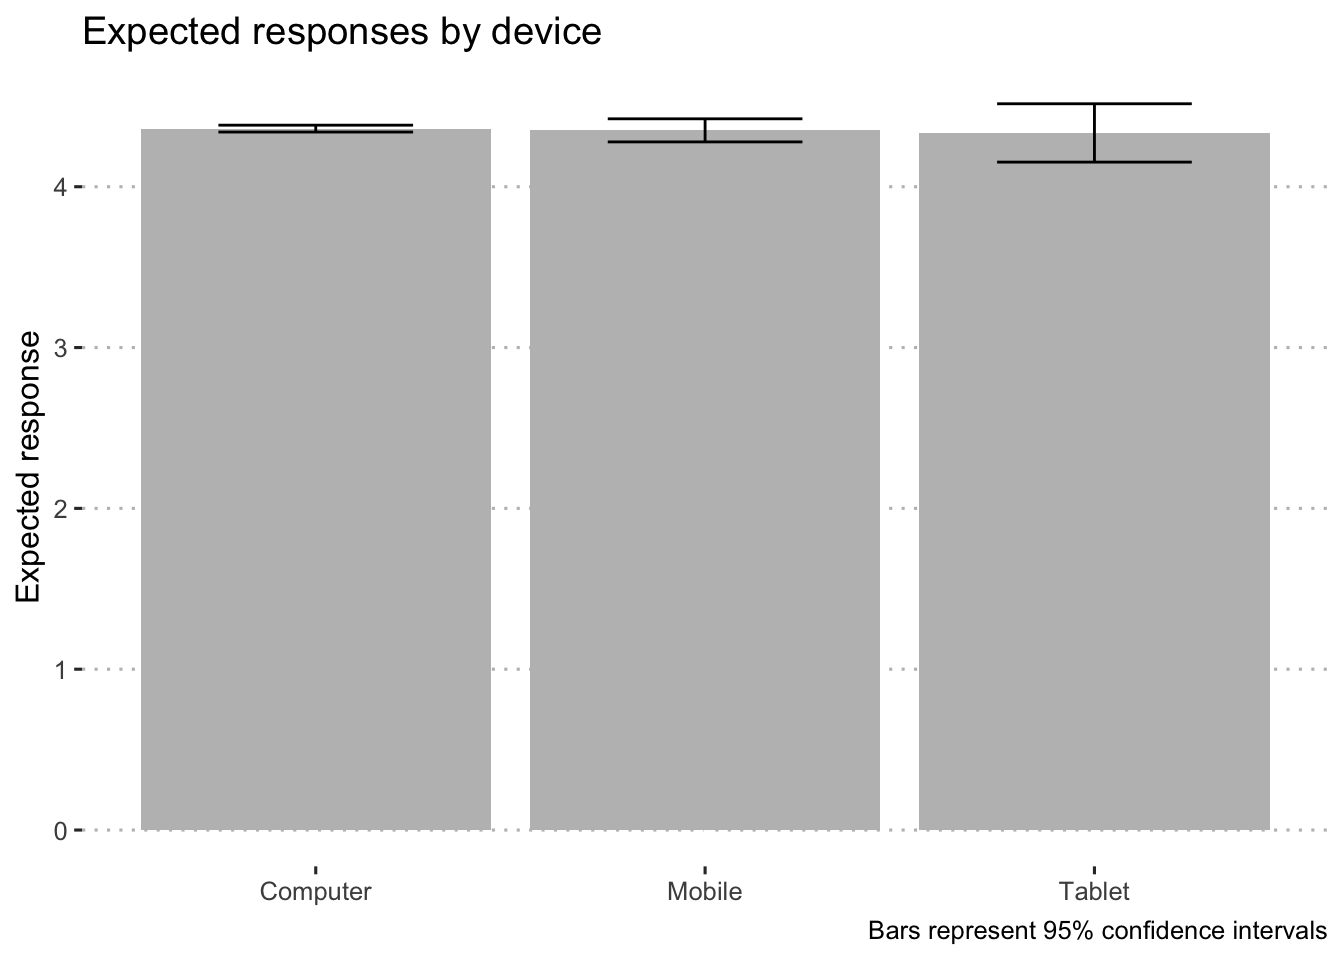
Predicted response on personality items by condition.
means_by_group = items_block1 %>%
  group_by(devicetype) %>%
  summarise(m = mean(response),
            s = sd(response))

items_block1 %>%
  ggplot(aes(x = response)) +
  geom_histogram(aes(fill = block),
                 position = "dodge",
                 bins = 6, color = "white") +
  geom_vline(aes(xintercept = m),
             data = means_by_group) +
  facet_wrap(~devicetype, scales = "free_y") +
  #guides(fill = "none") +
  scale_x_continuous(breaks = 1:6) +
  labs(y = "Number of particpants",
       title = "Distribution of responses by format") +
  theme_pubr()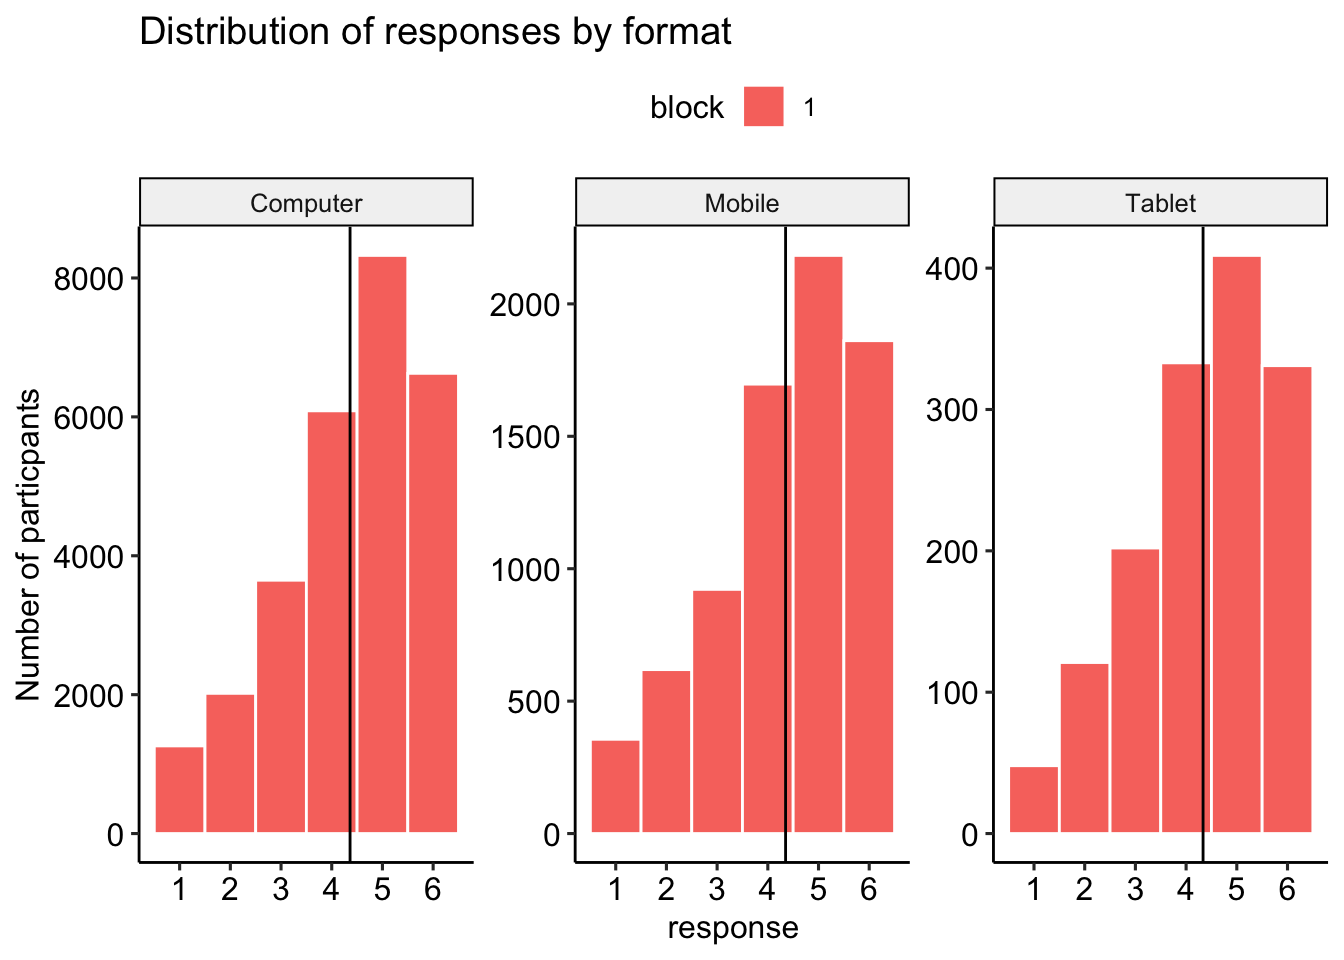
Distribution of responses by category
Device by format
We also check whether item format moderated the relationship between device type and response.
mod.responseD2 = glmmTMB(response~devicetype*format + (1|proid),
                  data = items_block1)
tidy(car::Anova(mod.responseD2))
## # A tibble: 3 × 4
## term statistic df p.value
## <chr> <dbl> <dbl> <dbl>
## 1 devicetype 0.148 2 0.929
## 2 format 6.60 3 0.0859
## 3 devicetype:format 1.62 6 0.951rD2_aov = tidy(aov(mod.responseD))
rD2_sig = rD2_aov$p.value[[3]] < .05
rD2_aov = rD2_aov %>%
as_tibble() %>%
mutate(across(starts_with("P"), printp),
across(where(is.numeric), printnum))The interaction between device type and format was NA with the time it took to respond to personality items \((\chi^2(36,075.00) = NA, p = )\).
avg_predictions(mod.responseD2, variables = c("devicetype", "format")) %>%
  ggplot(aes(x = format, y = estimate, group = devicetype)) +
  geom_bar(stat = "identity", aes(fill = devicetype),
           position = position_dodge(.9)) +
  geom_errorbar(aes(ymin = conf.low, ymax = conf.high),
                width = .5,
                position = position_dodge(.9)) +
   labs(x = NULL,
       y = "Average response",
       title = "Average responses by device",
       caption = "Bars represent 95% confidence intervals") +
  theme_pubclean()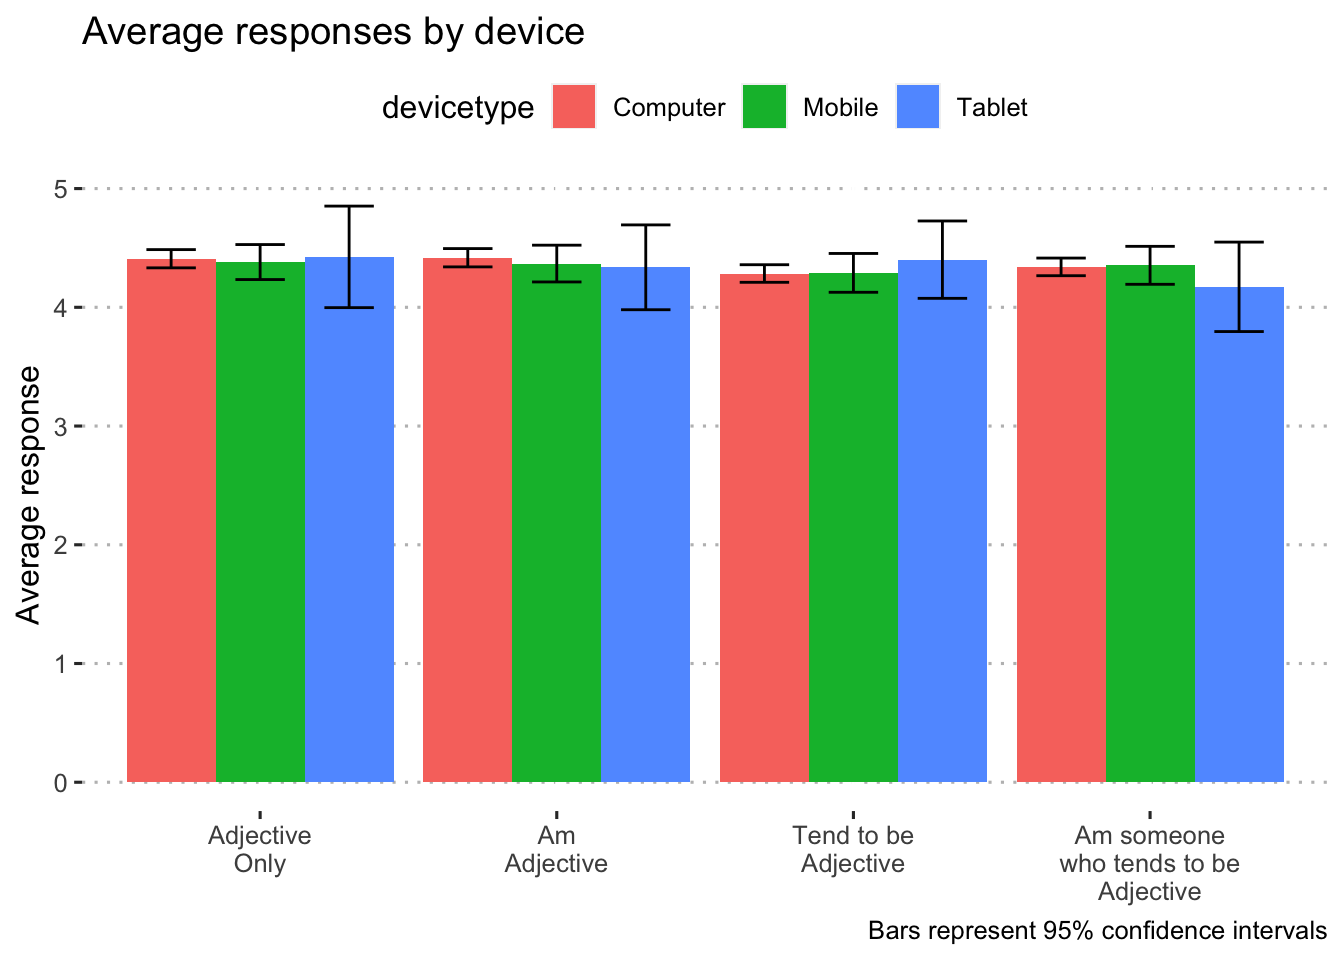
Predicted response on personality items by condition.