mod_enjoy_1 = lm(enjoy_responding ~ format, data = enjoy_df)
car::Anova(mod_enjoy_1)
Anova Table (Type II tests)
Response: enjoy_responding
Sum Sq Df F value Pr(>F)
format 5.21 3 1.6494 0.1764
Residuals 1022.53 971 These analyses test whether item format affects participants’ subjective experiences of participating in personality surveys.
First, we test whether participants enjoyed their experience as a function of format. The item participants rated was:
“Overall, I am enjoying responding to the present survey.”
mod_enjoy_1 = lm(enjoy_responding ~ format, data = enjoy_df)
car::Anova(mod_enjoy_1)Anova Table (Type II tests)
Response: enjoy_responding
Sum Sq Df F value Pr(>F)
format 5.21 3 1.6494 0.1764
Residuals 1022.53 971 effectsize::hedges_g(
enjoy_responding ~ format,
data = filter(enjoy_df, format %in% c("Adjective\nOnly", "Am\nAdjective")
))Hedges' g | 95% CI
-------------------------
-0.11 | [-0.29, 0.07]
- Estimated using pooled SD.effectsize::hedges_g(
enjoy_responding ~ format,
data = filter(enjoy_df, format %in% c("Adjective\nOnly", "Tend to be\nAdjective")))Hedges' g | 95% CI
-------------------------
-0.04 | [-0.21, 0.14]
- Estimated using pooled SD.effectsize::hedges_g(
enjoy_responding ~ format,
data = filter(enjoy_df, format %in% c("Adjective\nOnly", "Am someone\nwho tends to be\nAdjective")
))Hedges' g | 95% CI
--------------------------
-0.18 | [-0.36, 0.00]
- Estimated using pooled SD.effectsize::hedges_g(
enjoy_responding ~ format,
data = filter(enjoy_df, format %in% c("Am\nAdjective", "Tend to be\nAdjective")
))Hedges' g | 95% CI
-------------------------
0.08 | [-0.10, 0.26]
- Estimated using pooled SD.effectsize::hedges_g(
enjoy_responding ~ format,
data = filter(enjoy_df, format %in% c("Am\nAdjective", "Am someone\nwho tends to be\nAdjective")
))Hedges' g | 95% CI
-------------------------
-0.07 | [-0.25, 0.11]
- Estimated using pooled SD.effectsize::hedges_g(
enjoy_responding ~ format,
data = filter(enjoy_df, format %in% c("Tend to be\nAdjective", "Am someone\nwho tends to be\nAdjective")
))Hedges' g | 95% CI
-------------------------
-0.15 | [-0.33, 0.02]
- Estimated using pooled SD.Participants did not vary in their enjoyment of the survey as a function of item format. See @ref(fig:enjoyFormat).
plot_model(mod_enjoy_1, type = "pred", show.data = T, jitter = T) +
  labs(x = NULL,
       y = "Average enjoyment",
       title = NULL)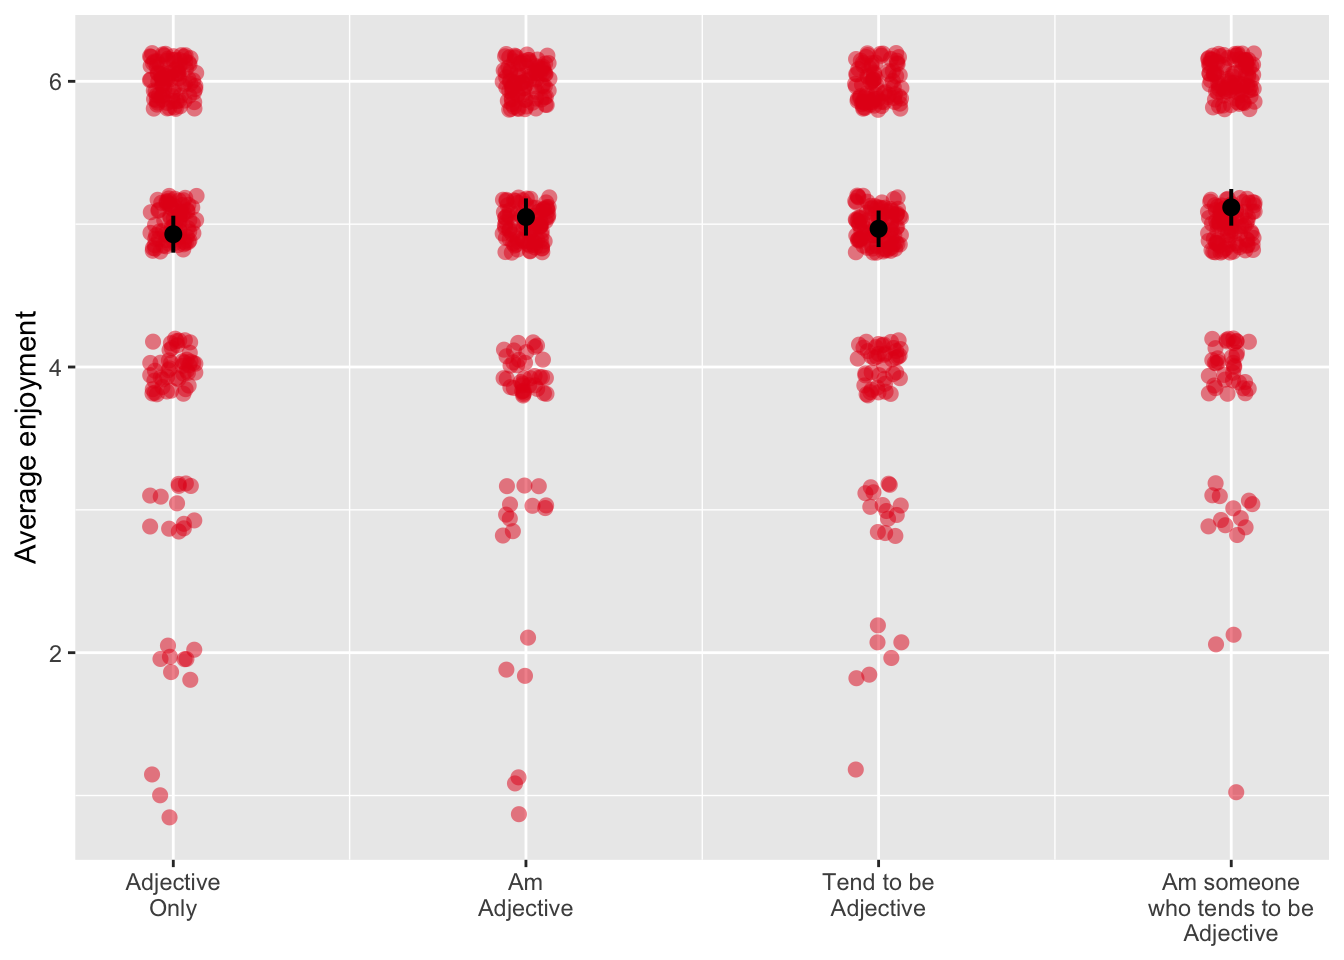
We also test whether this is a function of device type and the interaction of device type with format.
mod_enjoy_2 = lm(enjoy_responding ~ devicetype, data = enjoy_df)
car::Anova(mod_enjoy_2)
Anova Table (Type II tests)
Response: enjoy_responding
Sum Sq Df F value Pr(>F)
devicetype 2.97 2 1.4074 0.2453
Residuals 1024.77 972 Participants did not enjoy differently by device type.
mod_enjoy_3 = lm(enjoy_responding ~ format*devicetype, data = enjoy_df)
car::Anova(mod_enjoy_3, type = "3")
Anova Table (Type III tests)
Response: enjoy_responding
Sum Sq Df F value Pr(>F)
(Intercept) 4228.5 1 4016.2580 <2e-16 ***
format 5.5 3 1.7313 0.1589
devicetype 4.0 2 1.9136 0.1481
format:devicetype 5.6 6 0.8803 0.5087
Residuals 1013.9 963
---
Signif. codes: 0 '***' 0.001 '**' 0.01 '*' 0.05 '.' 0.1 ' ' 1The relationship of item format to enjoyment did not vary as a function of device type.
Next, we test whether participants viewed the survey differently as a function of format. The item participants rated was:
“Overall, I think the present survey is well designed.”
mod_design_1 = lm(well_designed_study ~ format, data = enjoy_df)
car::Anova(mod_design_1)
Anova Table (Type II tests)
Response: well_designed_study
Sum Sq Df F value Pr(>F)
format 2.88 3 1.2581 0.2875
Residuals 741.65 971 Participants did not vary in their perception of the survey as a function of device type. See @ref(fig:designFormat).
plot_model(mod_design_1, type = "pred", show.data = T, jitter = T) +
  labs(x = NULL,
       y = "Average perception",
       title = NULL)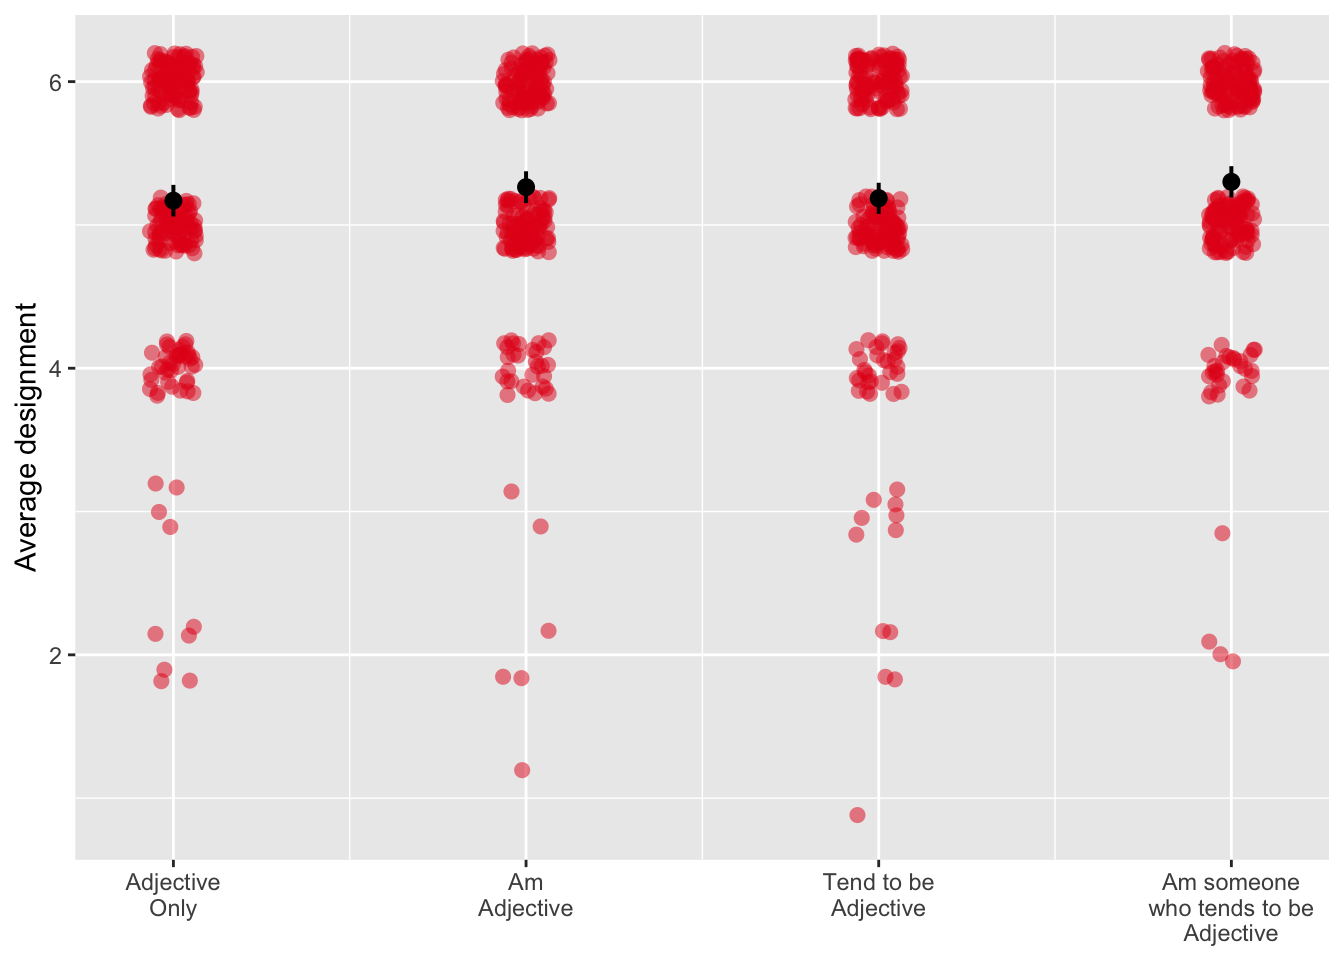
We also test whether this is a function of device type and the interaction of devicetype with format.
mod_design_2 = lm(well_designed_study ~ devicetype, data = enjoy_df)
car::Anova(mod_design_2)
Anova Table (Type II tests)
Response: well_designed_study
Sum Sq Df F value Pr(>F)
devicetype 4.73 2 3.1071 0.04518 *
Residuals 739.81 972
---
Signif. codes: 0 '***' 0.001 '**' 0.01 '*' 0.05 '.' 0.1 ' ' 1Participants did perceive the design of the study differently by format. We explore this more here:
emmeans(mod_design_2, pairwise~"devicetype", adjust = "none")$emmeans
devicetype emmean SE df
Desktop or laptop computer 5.20 0.0322 972
Mobile 5.36 0.0615 972
Tablet (for example, iPad, Galaxy Tablet, Amazon Fire, etc.) 5.08 0.1420 972
lower.CL upper.CL
5.14 5.27
5.24 5.48
4.80 5.36
Confidence level used: 0.95
$contrasts
contrast
Desktop or laptop computer - Mobile
Desktop or laptop computer - Tablet (for example, iPad, Galaxy Tablet, Amazon Fire, etc.)
Mobile - Tablet (for example, iPad, Galaxy Tablet, Amazon Fire, etc.)
estimate SE df t.ratio p.value
-0.156 0.0694 972 -2.243 0.0251
0.123 0.1450 972 0.851 0.3950
0.279 0.1540 972 1.810 0.0707emmeans(mod_design_2, pairwise~"devicetype", adjust = "holm")$emmeans
devicetype emmean SE df
Desktop or laptop computer 5.20 0.0322 972
Mobile 5.36 0.0615 972
Tablet (for example, iPad, Galaxy Tablet, Amazon Fire, etc.) 5.08 0.1420 972
lower.CL upper.CL
5.14 5.27
5.24 5.48
4.80 5.36
Confidence level used: 0.95
$contrasts
contrast
Desktop or laptop computer - Mobile
Desktop or laptop computer - Tablet (for example, iPad, Galaxy Tablet, Amazon Fire, etc.)
Mobile - Tablet (for example, iPad, Galaxy Tablet, Amazon Fire, etc.)
estimate SE df t.ratio p.value
-0.156 0.0694 972 -2.243 0.0753
0.123 0.1450 972 0.851 0.3950
0.279 0.1540 972 1.810 0.1413
P value adjustment: holm method for 3 tests Participants perceive the design to be better on mobile devices than on desktop or laptop computers; however, after correcting for multiple comparisons, this effect is no longer significant.
mod_design_3 = lm(well_designed_study ~ format*devicetype, data = enjoy_df)
car::Anova(mod_design_3, type = "3")
Anova Table (Type III tests)
Response: well_designed_study
Sum Sq Df F value Pr(>F)
(Intercept) 4718.2 1 6182.4022 <2e-16 ***
format 1.8 3 0.7901 0.4995
devicetype 0.9 2 0.5640 0.5691
format:devicetype 1.9 6 0.4124 0.8711
Residuals 734.9 963
---
Signif. codes: 0 '***' 0.001 '**' 0.01 '*' 0.05 '.' 0.1 ' ' 1The relationship of item format to survey design enjoyment did not vary as a function of device type.